Paenibacillus lentus
Taxonomy: cellular organisms; Bacteria; Terrabacteria group; Firmicutes; Bacilli; Bacillales; Paenibacillaceae; Paenibacillus
Average proteome isoelectric point is 6.23
Get precalculated fractions of proteins
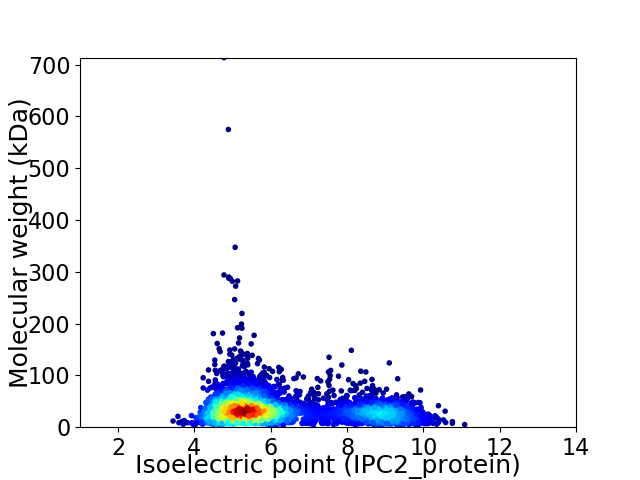
Virtual 2D-PAGE plot for 4362 proteins (isoelectric point calculated using IPC2_protein)
Get csv file with sequences according to given criteria:
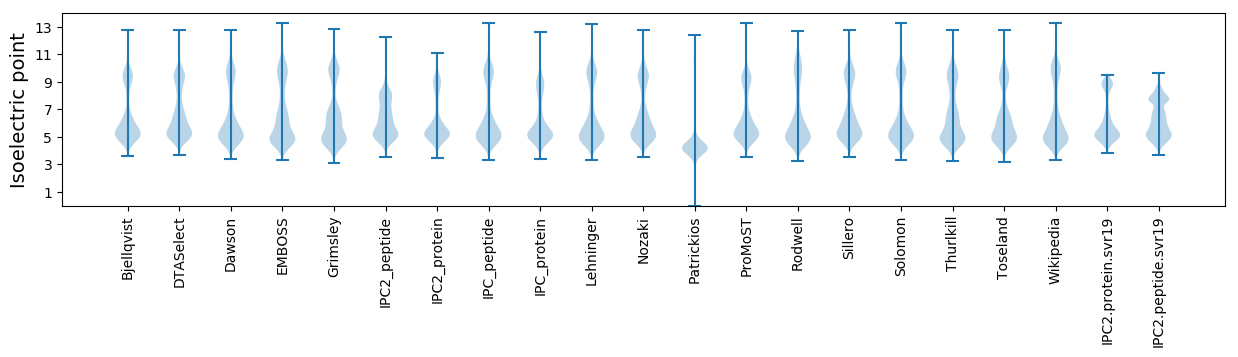
* You can choose from 21 different methods for calculating isoelectric point
Summary statistics related to proteome-wise predictions
Protein with the lowest isoelectric point:
>tr|A0A3Q8SAX9|A0A3Q8SAX9_9BACL Crossover junction endodeoxyribonuclease RuvC OS=Paenibacillus lentus OX=1338368 GN=ruvC PE=3 SV=1
MM1 pKa = 7.66LSICFPDD8 pKa = 3.87LPGAITCGEE17 pKa = 4.04NDD19 pKa = 3.34EE20 pKa = 4.5EE21 pKa = 4.17ALYY24 pKa = 9.4MAEE27 pKa = 4.58DD28 pKa = 4.25CLALHH33 pKa = 7.0LYY35 pKa = 10.4GMEE38 pKa = 4.16EE39 pKa = 4.76DD40 pKa = 3.97GDD42 pKa = 4.46EE43 pKa = 4.27IPEE46 pKa = 4.08SSRR49 pKa = 11.84DD50 pKa = 3.5KK51 pKa = 11.41LKK53 pKa = 10.26TNKK56 pKa = 9.4PLFPIGSGLLVSS68 pKa = 4.64
MM1 pKa = 7.66LSICFPDD8 pKa = 3.87LPGAITCGEE17 pKa = 4.04NDD19 pKa = 3.34EE20 pKa = 4.5EE21 pKa = 4.17ALYY24 pKa = 9.4MAEE27 pKa = 4.58DD28 pKa = 4.25CLALHH33 pKa = 7.0LYY35 pKa = 10.4GMEE38 pKa = 4.16EE39 pKa = 4.76DD40 pKa = 3.97GDD42 pKa = 4.46EE43 pKa = 4.27IPEE46 pKa = 4.08SSRR49 pKa = 11.84DD50 pKa = 3.5KK51 pKa = 11.41LKK53 pKa = 10.26TNKK56 pKa = 9.4PLFPIGSGLLVSS68 pKa = 4.64
Molecular weight: 7.4 kDa
Isoelectric point according different methods:
Protein with the highest isoelectric point:
>tr|A0A3Q8S9P0|A0A3Q8S9P0_9BACL ABC transporter permease OS=Paenibacillus lentus OX=1338368 GN=EIM92_04815 PE=3 SV=1
MM1 pKa = 7.59KK2 pKa = 8.7PTFKK6 pKa = 10.81PNVSKK11 pKa = 10.8RR12 pKa = 11.84KK13 pKa = 8.95KK14 pKa = 8.25VHH16 pKa = 5.49GFRR19 pKa = 11.84KK20 pKa = 10.01RR21 pKa = 11.84MSTKK25 pKa = 10.2NGRR28 pKa = 11.84KK29 pKa = 9.23VIAARR34 pKa = 11.84RR35 pKa = 11.84LKK37 pKa = 10.16GRR39 pKa = 11.84KK40 pKa = 8.79VLSAA44 pKa = 4.05
MM1 pKa = 7.59KK2 pKa = 8.7PTFKK6 pKa = 10.81PNVSKK11 pKa = 10.8RR12 pKa = 11.84KK13 pKa = 8.95KK14 pKa = 8.25VHH16 pKa = 5.49GFRR19 pKa = 11.84KK20 pKa = 10.01RR21 pKa = 11.84MSTKK25 pKa = 10.2NGRR28 pKa = 11.84KK29 pKa = 9.23VIAARR34 pKa = 11.84RR35 pKa = 11.84LKK37 pKa = 10.16GRR39 pKa = 11.84KK40 pKa = 8.79VLSAA44 pKa = 4.05
Molecular weight: 5.09 kDa
Isoelectric point according different methods:
Peptides (in silico digests for buttom-up proteomics)
Below you can find in silico digests of the whole proteome with Trypsin, Chymotrypsin, Trypsin+LysC, LysN, ArgC proteases suitable for different mass spec machines.| Try ESI |
 |
|---|
| ChTry ESI |
|
|---|
| ArgC ESI |
|
|---|
| LysN ESI |
|
|---|
| TryLysC ESI |
|
|---|
| Try MALDI |
|
|---|
| ChTry MALDI |
|
|---|
| ArgC MALDI |
|
|---|
| LysN MALDI |
|
|---|
| TryLysC MALDI |
|
|---|
| Try LTQ |
|
|---|
| ChTry LTQ |
|
|---|
| ArgC LTQ |
|
|---|
| LysN LTQ |
|
|---|
| TryLysC LTQ |
|
|---|
| Try MSlow |
|
|---|
| ChTry MSlow |
|
|---|
| ArgC MSlow |
|
|---|
| LysN MSlow |
|
|---|
| TryLysC MSlow |
|
|---|
| Try MShigh |
|
|---|
| ChTry MShigh |
|
|---|
| ArgC MShigh |
|
|---|
| LysN MShigh |
|
|---|
| TryLysC MShigh |
|
|---|
General Statistics
Number of major isoforms |
Number of additional isoforms |
Number of all proteins |
Number of amino acids |
Min. Seq. Length |
Max. Seq. Length |
Avg. Seq. Length |
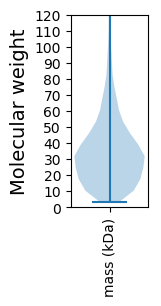
Avg. Mol. Weight |
|---|---|---|---|---|---|---|---|
0 |
1430031 |
26 |
6330 |
327.8 |
36.69 |
Amino acid frequency
Ala |
Cys |
Asp |
Glu |
Phe |
Gly |
His |
Ile |
Lys |
Leu |
|---|---|---|---|---|---|---|---|---|---|
7.711 ± 0.04 | 0.751 ± 0.009 |
5.155 ± 0.028 | 7.17 ± 0.043 |
4.105 ± 0.028 | 7.267 ± 0.037 |
2.123 ± 0.017 | 7.037 ± 0.039 |
5.472 ± 0.036 | 10.054 ± 0.041 |
Met |
Asn |
Gln |
Pro |
Arg |
Ser |
Thr |
Val |
Trp |
Tyr |
|---|---|---|---|---|---|---|---|---|---|
2.834 ± 0.017 | 3.998 ± 0.028 |
3.87 ± 0.026 | 4.034 ± 0.027 |
5.004 ± 0.04 | 6.389 ± 0.03 |
5.239 ± 0.026 | 6.92 ± 0.032 |
1.23 ± 0.016 | 3.639 ± 0.026 |
Most of the basic statistics you can see at this page can be downloaded from this CSV file
See this proteome in:

Proteome-pI is available under Creative Commons Attribution-NoDerivs license, for more details see here
| Reference: Kozlowski LP. Proteome-pI 2.0: Proteome Isoelectric Point Database Update. Nucleic Acids Res. 2021, doi: 10.1093/nar/gkab944 | Contact: Lukasz P. Kozlowski |