Borrelia duttonii CR2A
Taxonomy: cellular organisms; Bacteria; Spirochaetes; Spirochaetia; Spirochaetales; Borreliaceae; Borrelia; Borrelia duttonii
Average proteome isoelectric point is 7.22
Get precalculated fractions of proteins
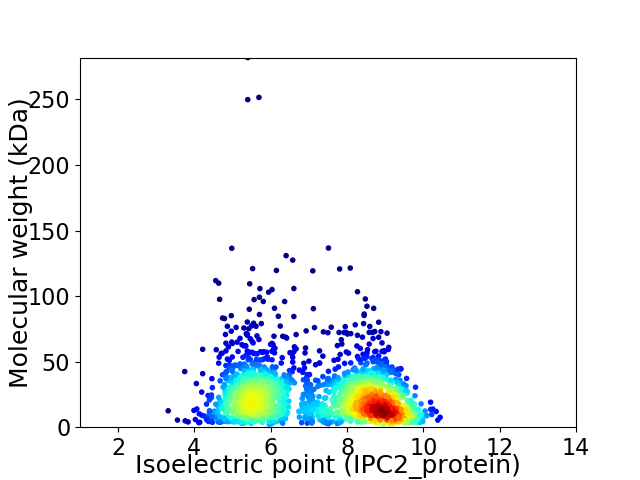
Virtual 2D-PAGE plot for 1995 proteins (isoelectric point calculated using IPC2_protein)
Get csv file with sequences according to given criteria:
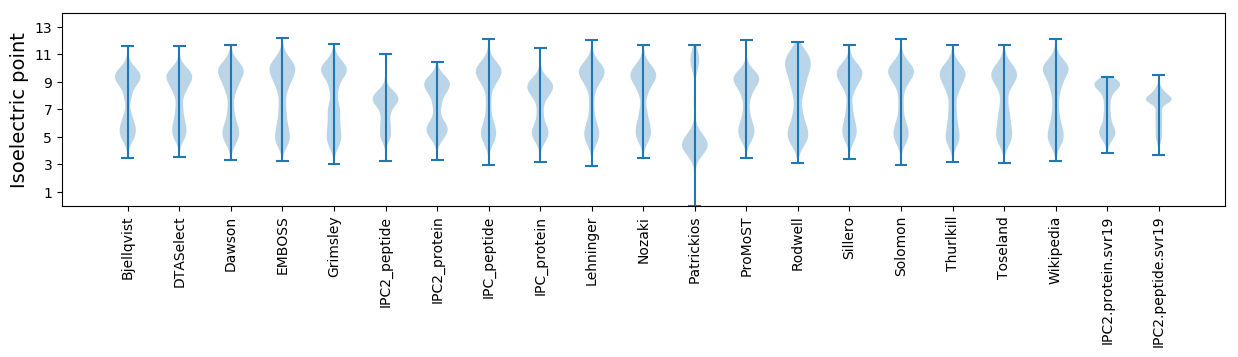
* You can choose from 21 different methods for calculating isoelectric point
Summary statistics related to proteome-wise predictions
Protein with the lowest isoelectric point:
>tr|W6TJQ3|W6TJQ3_9SPIR Ribonuclease Z OS=Borrelia duttonii CR2A OX=1432657 GN=BDCR2A_00926 PE=4 SV=1
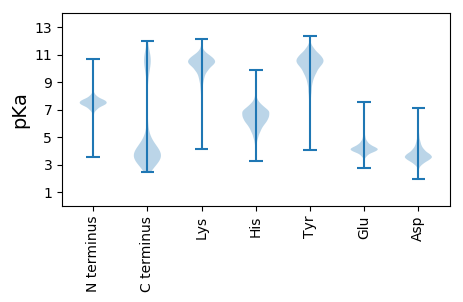
MM1 pKa = 6.97KK2 pKa = 9.72TINFTLILLLLMSNCEE18 pKa = 3.64QDD20 pKa = 4.5NNINDD25 pKa = 4.77DD26 pKa = 3.33IEE28 pKa = 4.64YY29 pKa = 10.28IQLQLL34 pKa = 3.81
MM1 pKa = 6.97KK2 pKa = 9.72TINFTLILLLLMSNCEE18 pKa = 3.64QDD20 pKa = 4.5NNINDD25 pKa = 4.77DD26 pKa = 3.33IEE28 pKa = 4.64YY29 pKa = 10.28IQLQLL34 pKa = 3.81
Molecular weight: 4.03 kDa
Isoelectric point according different methods:
Protein with the highest isoelectric point:
>tr|W6TJH6|W6TJH6_9SPIR Uncharacterized protein OS=Borrelia duttonii CR2A OX=1432657 GN=BDCR2A_00816 PE=4 SV=1
MM1 pKa = 7.67AVPKK5 pKa = 9.82FKK7 pKa = 10.16PSKK10 pKa = 9.35SRR12 pKa = 11.84SRR14 pKa = 11.84TRR16 pKa = 11.84RR17 pKa = 11.84SINMRR22 pKa = 11.84KK23 pKa = 9.83KK24 pKa = 9.1IPQFQEE30 pKa = 3.95CSNCGNLAIRR40 pKa = 11.84HH41 pKa = 6.27RR42 pKa = 11.84ICAKK46 pKa = 9.54CGYY49 pKa = 8.75YY50 pKa = 10.33RR51 pKa = 11.84NSQYY55 pKa = 11.49LEE57 pKa = 4.29LGLL60 pKa = 4.64
MM1 pKa = 7.67AVPKK5 pKa = 9.82FKK7 pKa = 10.16PSKK10 pKa = 9.35SRR12 pKa = 11.84SRR14 pKa = 11.84TRR16 pKa = 11.84RR17 pKa = 11.84SINMRR22 pKa = 11.84KK23 pKa = 9.83KK24 pKa = 9.1IPQFQEE30 pKa = 3.95CSNCGNLAIRR40 pKa = 11.84HH41 pKa = 6.27RR42 pKa = 11.84ICAKK46 pKa = 9.54CGYY49 pKa = 8.75YY50 pKa = 10.33RR51 pKa = 11.84NSQYY55 pKa = 11.49LEE57 pKa = 4.29LGLL60 pKa = 4.64
Molecular weight: 7.04 kDa
Isoelectric point according different methods:
Peptides (in silico digests for buttom-up proteomics)
Below you can find in silico digests of the whole proteome with Trypsin, Chymotrypsin, Trypsin+LysC, LysN, ArgC proteases suitable for different mass spec machines.| Try ESI |
 |
|---|
| ChTry ESI |
|
|---|
| ArgC ESI |
|
|---|
| LysN ESI |
|
|---|
| TryLysC ESI |
|
|---|
| Try MALDI |
|
|---|
| ChTry MALDI |
|
|---|
| ArgC MALDI |
|
|---|
| LysN MALDI |
|
|---|
| TryLysC MALDI |
|
|---|
| Try LTQ |
|
|---|
| ChTry LTQ |
|
|---|
| ArgC LTQ |
|
|---|
| LysN LTQ |
|
|---|
| TryLysC LTQ |
|
|---|
| Try MSlow |
|
|---|
| ChTry MSlow |
|
|---|
| ArgC MSlow |
|
|---|
| LysN MSlow |
|
|---|
| TryLysC MSlow |
|
|---|
| Try MShigh |
|
|---|
| ChTry MShigh |
|
|---|
| ArgC MShigh |
|
|---|
| LysN MShigh |
|
|---|
| TryLysC MShigh |
|
|---|
General Statistics
Number of major isoforms |
Number of additional isoforms |
Number of all proteins |
Number of amino acids |
Min. Seq. Length |
Max. Seq. Length |
Avg. Seq. Length |
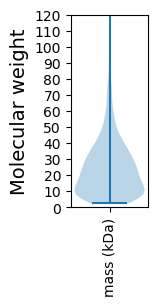
Avg. Mol. Weight |
|---|---|---|---|---|---|---|---|
0 |
448606 |
20 |
2438 |
224.9 |
25.68 |
Amino acid frequency
Ala |
Cys |
Asp |
Glu |
Phe |
Gly |
His |
Ile |
Lys |
Leu |
|---|---|---|---|---|---|---|---|---|---|
5.026 ± 0.081 | 0.803 ± 0.019 |
5.695 ± 0.061 | 6.757 ± 0.066 |
5.431 ± 0.064 | 5.36 ± 0.088 |
1.348 ± 0.022 | 10.073 ± 0.087 |
10.081 ± 0.083 | 9.911 ± 0.061 |
Met |
Asn |
Gln |
Pro |
Arg |
Ser |
Thr |
Val |
Trp |
Tyr |
|---|---|---|---|---|---|---|---|---|---|
2.234 ± 0.03 | 7.263 ± 0.078 |
2.189 ± 0.033 | 2.687 ± 0.044 |
3.452 ± 0.043 | 6.913 ± 0.051 |
4.334 ± 0.05 | 5.833 ± 0.078 |
0.475 ± 0.015 | 4.134 ± 0.049 |
Most of the basic statistics you can see at this page can be downloaded from this CSV file
See this proteome in:

Proteome-pI is available under Creative Commons Attribution-NoDerivs license, for more details see here
| Reference: Kozlowski LP. Proteome-pI 2.0: Proteome Isoelectric Point Database Update. Nucleic Acids Res. 2021, doi: 10.1093/nar/gkab944 | Contact: Lukasz P. Kozlowski |