Pseudomonas virus H66
Taxonomy: Viruses; Duplodnaviria; Heunggongvirae; Uroviricota; Caudoviricetes; Caudovirales; Podoviridae; Hollowayvirus
Average proteome isoelectric point is 6.65
Get precalculated fractions of proteins
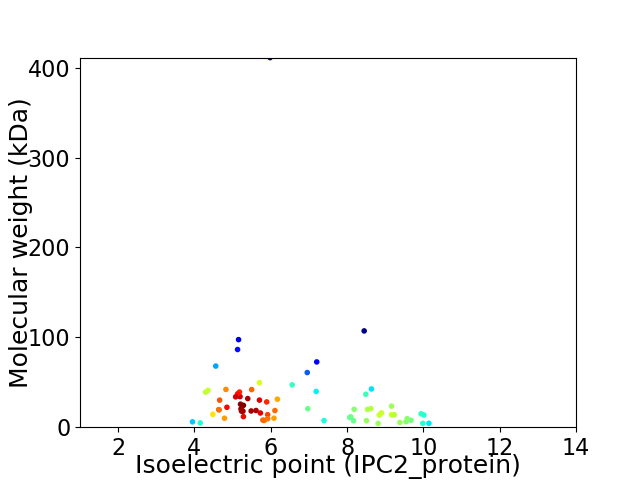
Virtual 2D-PAGE plot for 71 proteins (isoelectric point calculated using IPC2_protein)
Get csv file with sequences according to given criteria:
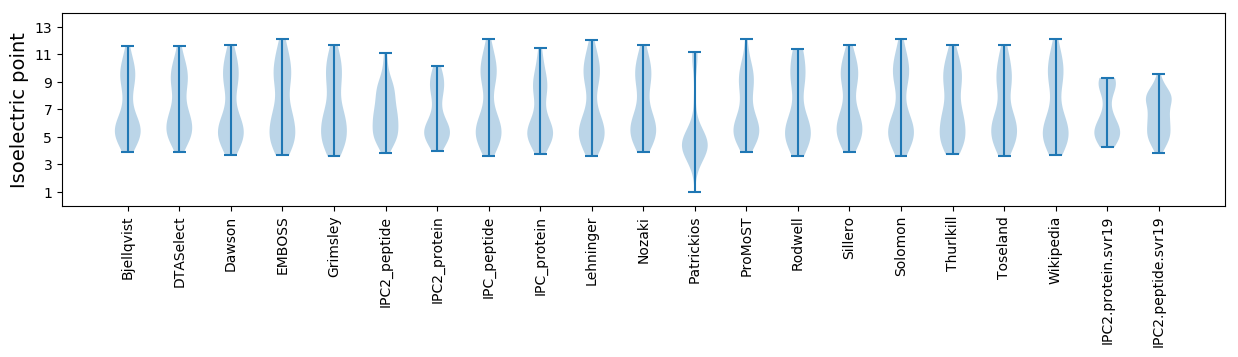
* You can choose from 21 different methods for calculating isoelectric point
Summary statistics related to proteome-wise predictions
Protein with the lowest isoelectric point:
>tr|L7TP23|L7TP23_9CAUD Uncharacterized protein OS=Pseudomonas virus H66 OX=1273707 GN=H66_0031 PE=4 SV=1
MM1 pKa = 6.67MWTYY5 pKa = 11.07RR6 pKa = 11.84EE7 pKa = 3.91RR8 pKa = 11.84HH9 pKa = 5.13NRR11 pKa = 11.84AAFNCAQQAWDD22 pKa = 4.29RR23 pKa = 11.84EE24 pKa = 4.2VDD26 pKa = 4.05PLWDD30 pKa = 3.86QPDD33 pKa = 4.44PDD35 pKa = 4.45PQDD38 pKa = 3.65EE39 pKa = 4.29EE40 pKa = 4.47QEE42 pKa = 4.14NDD44 pKa = 4.79DD45 pKa = 5.3GLQQQ49 pKa = 3.72
MM1 pKa = 6.67MWTYY5 pKa = 11.07RR6 pKa = 11.84EE7 pKa = 3.91RR8 pKa = 11.84HH9 pKa = 5.13NRR11 pKa = 11.84AAFNCAQQAWDD22 pKa = 4.29RR23 pKa = 11.84EE24 pKa = 4.2VDD26 pKa = 4.05PLWDD30 pKa = 3.86QPDD33 pKa = 4.44PDD35 pKa = 4.45PQDD38 pKa = 3.65EE39 pKa = 4.29EE40 pKa = 4.47QEE42 pKa = 4.14NDD44 pKa = 4.79DD45 pKa = 5.3GLQQQ49 pKa = 3.72
Molecular weight: 5.98 kDa
Isoelectric point according different methods:
Protein with the highest isoelectric point:
>tr|L7TKP8|L7TKP8_9CAUD Uncharacterized protein OS=Pseudomonas virus H66 OX=1273707 GN=H66_004 PE=4 SV=1
MM1 pKa = 7.83TYY3 pKa = 9.83TDD5 pKa = 3.28EE6 pKa = 5.08RR7 pKa = 11.84GTFILRR13 pKa = 11.84WTRR16 pKa = 11.84RR17 pKa = 11.84LKK19 pKa = 10.69NGQIQRR25 pKa = 11.84AVGKK29 pKa = 8.8PFKK32 pKa = 10.47IYY34 pKa = 10.34ISS36 pKa = 3.57
MM1 pKa = 7.83TYY3 pKa = 9.83TDD5 pKa = 3.28EE6 pKa = 5.08RR7 pKa = 11.84GTFILRR13 pKa = 11.84WTRR16 pKa = 11.84RR17 pKa = 11.84LKK19 pKa = 10.69NGQIQRR25 pKa = 11.84AVGKK29 pKa = 8.8PFKK32 pKa = 10.47IYY34 pKa = 10.34ISS36 pKa = 3.57
Molecular weight: 4.35 kDa
Isoelectric point according different methods:
Peptides (in silico digests for buttom-up proteomics)
Below you can find in silico digests of the whole proteome with Trypsin, Chymotrypsin, Trypsin+LysC, LysN, ArgC proteases suitable for different mass spec machines.| Try ESI |
 |
|---|
| ChTry ESI |
|
|---|
| ArgC ESI |
|
|---|
| LysN ESI |
|
|---|
| TryLysC ESI |
|
|---|
| Try MALDI |
|
|---|
| ChTry MALDI |
|
|---|
| ArgC MALDI |
|
|---|
| LysN MALDI |
|
|---|
| TryLysC MALDI |
|
|---|
| Try LTQ |
|
|---|
| ChTry LTQ |
|
|---|
| ArgC LTQ |
|
|---|
| LysN LTQ |
|
|---|
| TryLysC LTQ |
|
|---|
| Try MSlow |
|
|---|
| ChTry MSlow |
|
|---|
| ArgC MSlow |
|
|---|
| LysN MSlow |
|
|---|
| TryLysC MSlow |
|
|---|
| Try MShigh |
|
|---|
| ChTry MShigh |
|
|---|
| ArgC MShigh |
|
|---|
| LysN MShigh |
|
|---|
| TryLysC MShigh |
|
|---|
General Statistics
Number of major isoforms |
Number of additional isoforms |
Number of all proteins |
Number of amino acids |
Min. Seq. Length |
Max. Seq. Length |
Avg. Seq. Length |
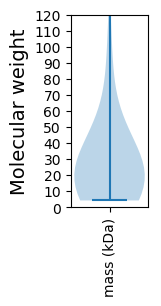
Avg. Mol. Weight |
|---|---|---|---|---|---|---|---|
0 |
20131 |
36 |
3787 |
283.5 |
31.07 |
Amino acid frequency
Ala |
Cys |
Asp |
Glu |
Phe |
Gly |
His |
Ile |
Lys |
Leu |
|---|---|---|---|---|---|---|---|---|---|
12.478 ± 0.63 | 0.84 ± 0.193 |
6.16 ± 0.193 | 6.348 ± 0.268 |
3.05 ± 0.165 | 7.893 ± 0.307 |
1.972 ± 0.163 | 4.257 ± 0.259 |
4.128 ± 0.258 | 8.246 ± 0.292 |
Met |
Asn |
Gln |
Pro |
Arg |
Ser |
Thr |
Val |
Trp |
Tyr |
|---|---|---|---|---|---|---|---|---|---|
2.444 ± 0.109 | 2.966 ± 0.133 |
5.33 ± 0.353 | 5.112 ± 0.244 |
7.337 ± 0.305 | 5.559 ± 0.172 |
5.256 ± 0.247 | 6.607 ± 0.222 |
1.45 ± 0.145 | 2.568 ± 0.226 |
Most of the basic statistics you can see at this page can be downloaded from this CSV file
See this proteome in:

Proteome-pI is available under Creative Commons Attribution-NoDerivs license, for more details see here
| Reference: Kozlowski LP. Proteome-pI 2.0: Proteome Isoelectric Point Database Update. Nucleic Acids Res. 2021, doi: 10.1093/nar/gkab944 | Contact: Lukasz P. Kozlowski |