Lettuce chlorosis virus
Taxonomy: Viruses; Riboviria; Orthornavirae; Kitrinoviricota; Alsuviricetes; Martellivirales; Closteroviridae; Crinivirus
Average proteome isoelectric point is 6.72
Get precalculated fractions of proteins
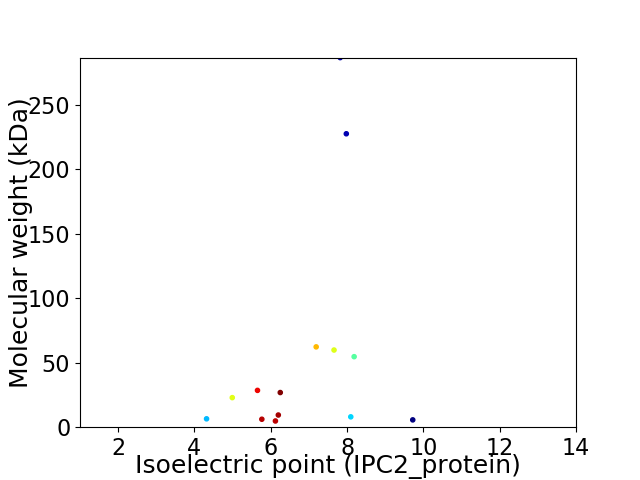
Virtual 2D-PAGE plot for 14 proteins (isoelectric point calculated using IPC2_protein)
Get csv file with sequences according to given criteria:
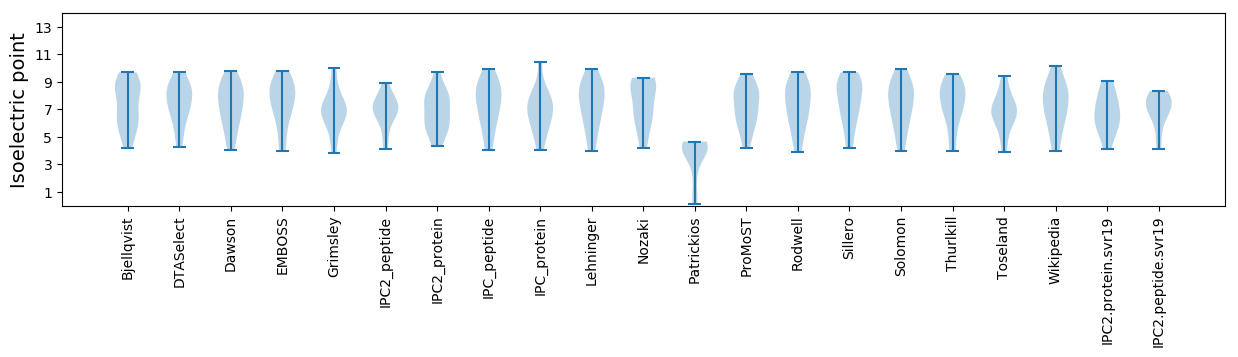
* You can choose from 21 different methods for calculating isoelectric point
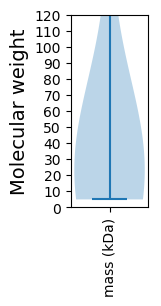
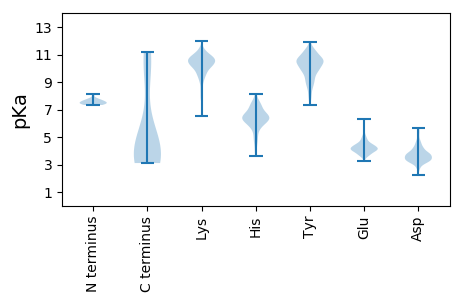
Summary statistics related to proteome-wise predictions
Protein with the lowest isoelectric point:
>tr|C6FJ61|C6FJ61_9CLOS ORF5 p60 OS=Lettuce chlorosis virus OX=642478 PE=4 SV=1
MM1 pKa = 7.35GLKK4 pKa = 9.82IVLYY8 pKa = 9.58YY9 pKa = 8.68FNCGFSLYY17 pKa = 9.95YY18 pKa = 10.8CSDD21 pKa = 2.87NRR23 pKa = 11.84LFEE26 pKa = 4.34GQVDD30 pKa = 4.44TIYY33 pKa = 10.98TEE35 pKa = 5.62DD36 pKa = 3.46IQEE39 pKa = 4.64LIEE42 pKa = 4.83IINNFPFVKK51 pKa = 9.44TQWW54 pKa = 3.11
MM1 pKa = 7.35GLKK4 pKa = 9.82IVLYY8 pKa = 9.58YY9 pKa = 8.68FNCGFSLYY17 pKa = 9.95YY18 pKa = 10.8CSDD21 pKa = 2.87NRR23 pKa = 11.84LFEE26 pKa = 4.34GQVDD30 pKa = 4.44TIYY33 pKa = 10.98TEE35 pKa = 5.62DD36 pKa = 3.46IQEE39 pKa = 4.64LIEE42 pKa = 4.83IINNFPFVKK51 pKa = 9.44TQWW54 pKa = 3.11
Molecular weight: 6.5 kDa
Isoelectric point according different methods:
Protein with the highest isoelectric point:
>tr|C6FJ56|C6FJ56_9CLOS p23 OS=Lettuce chlorosis virus OX=642478 PE=4 SV=1
MM1 pKa = 7.49IYY3 pKa = 10.29VYY5 pKa = 9.9PAYY8 pKa = 9.92CDD10 pKa = 4.88KK11 pKa = 10.34EE12 pKa = 4.33TQTYY16 pKa = 10.22NKK18 pKa = 9.1SLCGFYY24 pKa = 8.12TTFEE28 pKa = 4.42WIGFILILLILLFFICYY45 pKa = 9.19VVSSYY50 pKa = 7.57TLRR53 pKa = 11.84VRR55 pKa = 11.84NSRR58 pKa = 11.84WRR60 pKa = 11.84RR61 pKa = 11.84EE62 pKa = 3.78IPIVV66 pKa = 3.38
MM1 pKa = 7.49IYY3 pKa = 10.29VYY5 pKa = 9.9PAYY8 pKa = 9.92CDD10 pKa = 4.88KK11 pKa = 10.34EE12 pKa = 4.33TQTYY16 pKa = 10.22NKK18 pKa = 9.1SLCGFYY24 pKa = 8.12TTFEE28 pKa = 4.42WIGFILILLILLFFICYY45 pKa = 9.19VVSSYY50 pKa = 7.57TLRR53 pKa = 11.84VRR55 pKa = 11.84NSRR58 pKa = 11.84WRR60 pKa = 11.84RR61 pKa = 11.84EE62 pKa = 3.78IPIVV66 pKa = 3.38
Molecular weight: 8.03 kDa
Isoelectric point according different methods:
Peptides (in silico digests for buttom-up proteomics)
Below you can find in silico digests of the whole proteome with Trypsin, Chymotrypsin, Trypsin+LysC, LysN, ArgC proteases suitable for different mass spec machines.| Try ESI |
 |
|---|
| ChTry ESI |
|
|---|
| ArgC ESI |
|
|---|
| LysN ESI |
|
|---|
| TryLysC ESI |
|
|---|
| Try MALDI |
|
|---|
| ChTry MALDI |
|
|---|
| ArgC MALDI |
|
|---|
| LysN MALDI |
|
|---|
| TryLysC MALDI |
|
|---|
| Try LTQ |
|
|---|
| ChTry LTQ |
|
|---|
| ArgC LTQ |
|
|---|
| LysN LTQ |
|
|---|
| TryLysC LTQ |
|
|---|
| Try MSlow |
|
|---|
| ChTry MSlow |
|
|---|
| ArgC MSlow |
|
|---|
| LysN MSlow |
|
|---|
| TryLysC MSlow |
|
|---|
| Try MShigh |
|
|---|
| ChTry MShigh |
|
|---|
| ArgC MShigh |
|
|---|
| LysN MShigh |
|
|---|
| TryLysC MShigh |
|
|---|
General Statistics
Number of major isoforms |
Number of additional isoforms |
Number of all proteins |
Number of amino acids |
Min. Seq. Length |
Max. Seq. Length |
Avg. Seq. Length |
Avg. Mol. Weight |
|---|---|---|---|---|---|---|---|
0 |
7056 |
42 |
2495 |
504.0 |
57.84 |
Amino acid frequency
Ala |
Cys |
Asp |
Glu |
Phe |
Gly |
His |
Ile |
Lys |
Leu |
|---|---|---|---|---|---|---|---|---|---|
4.294 ± 0.354 | 2.282 ± 0.255 |
6.236 ± 0.299 | 5.371 ± 0.259 |
5.102 ± 0.297 | 5.003 ± 0.185 |
2.225 ± 0.203 | 6.463 ± 0.327 |
7.937 ± 0.214 | 8.844 ± 0.503 |
Met |
Asn |
Gln |
Pro |
Arg |
Ser |
Thr |
Val |
Trp |
Tyr |
|---|---|---|---|---|---|---|---|---|---|
2.948 ± 0.173 | 6.222 ± 0.293 |
3.373 ± 0.349 | 2.891 ± 0.143 |
4.776 ± 0.208 | 7.526 ± 0.225 |
5.442 ± 0.241 | 7.299 ± 0.403 |
0.865 ± 0.099 | 4.904 ± 0.302 |
Most of the basic statistics you can see at this page can be downloaded from this CSV file
See this proteome in:

Proteome-pI is available under Creative Commons Attribution-NoDerivs license, for more details see here
| Reference: Kozlowski LP. Proteome-pI 2.0: Proteome Isoelectric Point Database Update. Nucleic Acids Res. 2021, doi: 10.1093/nar/gkab944 | Contact: Lukasz P. Kozlowski |