Nonomuraea sp. C10
Taxonomy: cellular organisms; Bacteria; Terrabacteria group; Actinobacteria; Actinomycetia; Streptosporangiales; Streptosporangiaceae; Nonomuraea; unclassified Nonomuraea
Average proteome isoelectric point is 6.45
Get precalculated fractions of proteins
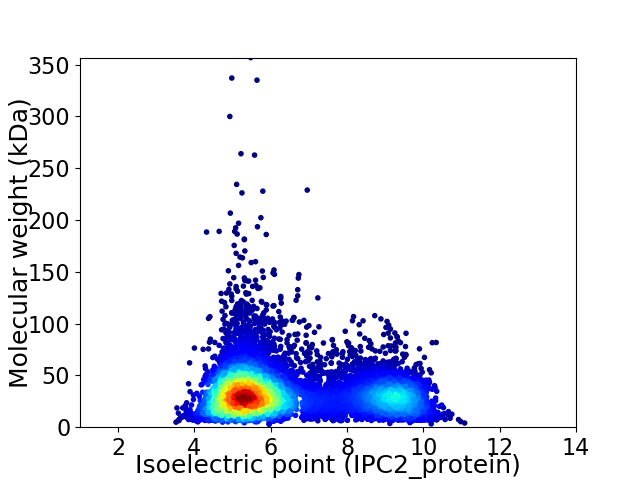
Virtual 2D-PAGE plot for 8383 proteins (isoelectric point calculated using IPC2_protein)
Get csv file with sequences according to given criteria:
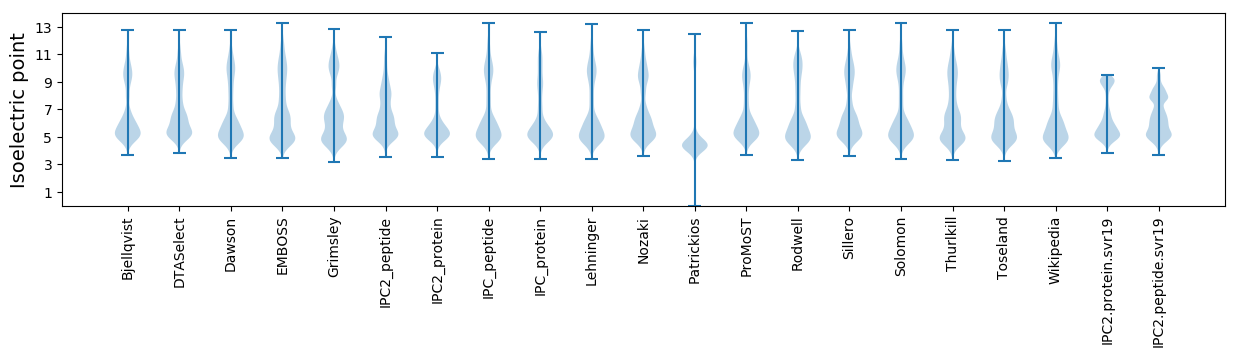
* You can choose from 21 different methods for calculating isoelectric point
Summary statistics related to proteome-wise predictions
Protein with the lowest isoelectric point:
>tr|A0A5C8JV71|A0A5C8JV71_9ACTN ABC transporter permease OS=Nonomuraea sp. C10 OX=2600577 GN=FR742_24465 PE=3 SV=1
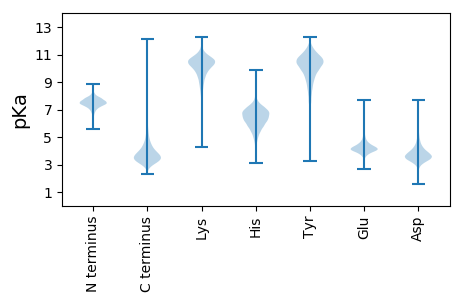
MM1 pKa = 7.33SAEE4 pKa = 3.97NLKK7 pKa = 10.66LDD9 pKa = 4.85LRR11 pKa = 11.84GLDD14 pKa = 3.19VDD16 pKa = 4.43SIEE19 pKa = 4.37VVSADD24 pKa = 3.45SLVVEE29 pKa = 4.0GHH31 pKa = 5.88GAIEE35 pKa = 4.31TGASSALGYY44 pKa = 10.27CSSYY48 pKa = 10.09LTATSCWAPEE58 pKa = 3.73AA59 pKa = 4.31
MM1 pKa = 7.33SAEE4 pKa = 3.97NLKK7 pKa = 10.66LDD9 pKa = 4.85LRR11 pKa = 11.84GLDD14 pKa = 3.19VDD16 pKa = 4.43SIEE19 pKa = 4.37VVSADD24 pKa = 3.45SLVVEE29 pKa = 4.0GHH31 pKa = 5.88GAIEE35 pKa = 4.31TGASSALGYY44 pKa = 10.27CSSYY48 pKa = 10.09LTATSCWAPEE58 pKa = 3.73AA59 pKa = 4.31
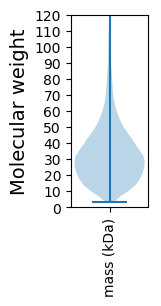
Molecular weight: 6.06 kDa
Isoelectric point according different methods:
Protein with the highest isoelectric point:
>tr|A0A5C8JDA8|A0A5C8JDA8_9ACTN SDR family oxidoreductase OS=Nonomuraea sp. C10 OX=2600577 GN=FR742_36120 PE=4 SV=1
MM1 pKa = 7.4GSVIKK6 pKa = 10.42KK7 pKa = 8.47RR8 pKa = 11.84RR9 pKa = 11.84KK10 pKa = 9.22RR11 pKa = 11.84MAKK14 pKa = 9.41KK15 pKa = 9.99KK16 pKa = 9.77HH17 pKa = 5.81RR18 pKa = 11.84KK19 pKa = 8.55LLKK22 pKa = 8.44KK23 pKa = 9.17TRR25 pKa = 11.84IQRR28 pKa = 11.84RR29 pKa = 11.84NKK31 pKa = 9.73KK32 pKa = 9.84
MM1 pKa = 7.4GSVIKK6 pKa = 10.42KK7 pKa = 8.47RR8 pKa = 11.84RR9 pKa = 11.84KK10 pKa = 9.22RR11 pKa = 11.84MAKK14 pKa = 9.41KK15 pKa = 9.99KK16 pKa = 9.77HH17 pKa = 5.81RR18 pKa = 11.84KK19 pKa = 8.55LLKK22 pKa = 8.44KK23 pKa = 9.17TRR25 pKa = 11.84IQRR28 pKa = 11.84RR29 pKa = 11.84NKK31 pKa = 9.73KK32 pKa = 9.84
Molecular weight: 4.03 kDa
Isoelectric point according different methods:
Peptides (in silico digests for buttom-up proteomics)
Below you can find in silico digests of the whole proteome with Trypsin, Chymotrypsin, Trypsin+LysC, LysN, ArgC proteases suitable for different mass spec machines.| Try ESI |
 |
|---|
| ChTry ESI |
|
|---|
| ArgC ESI |
|
|---|
| LysN ESI |
|
|---|
| TryLysC ESI |
|
|---|
| Try MALDI |
|
|---|
| ChTry MALDI |
|
|---|
| ArgC MALDI |
|
|---|
| LysN MALDI |
|
|---|
| TryLysC MALDI |
|
|---|
| Try LTQ |
|
|---|
| ChTry LTQ |
|
|---|
| ArgC LTQ |
|
|---|
| LysN LTQ |
|
|---|
| TryLysC LTQ |
|
|---|
| Try MSlow |
|
|---|
| ChTry MSlow |
|
|---|
| ArgC MSlow |
|
|---|
| LysN MSlow |
|
|---|
| TryLysC MSlow |
|
|---|
| Try MShigh |
|
|---|
| ChTry MShigh |
|
|---|
| ArgC MShigh |
|
|---|
| LysN MShigh |
|
|---|
| TryLysC MShigh |
|
|---|
General Statistics
Number of major isoforms |
Number of additional isoforms |
Number of all proteins |
Number of amino acids |
Min. Seq. Length |
Max. Seq. Length |
Avg. Seq. Length |
Avg. Mol. Weight |
|---|---|---|---|---|---|---|---|
0 |
2740636 |
27 |
3313 |
326.9 |
35.13 |
Amino acid frequency
Ala |
Cys |
Asp |
Glu |
Phe |
Gly |
His |
Ile |
Lys |
Leu |
|---|---|---|---|---|---|---|---|---|---|
13.305 ± 0.038 | 0.787 ± 0.008 |
5.793 ± 0.022 | 5.841 ± 0.028 |
2.847 ± 0.016 | 9.525 ± 0.03 |
2.216 ± 0.012 | 3.444 ± 0.019 |
1.977 ± 0.017 | 10.637 ± 0.036 |
Met |
Asn |
Gln |
Pro |
Arg |
Ser |
Thr |
Val |
Trp |
Tyr |
|---|---|---|---|---|---|---|---|---|---|
1.922 ± 0.012 | 1.688 ± 0.013 |
6.028 ± 0.023 | 2.59 ± 0.016 |
8.375 ± 0.03 | 4.846 ± 0.019 |
5.678 ± 0.022 | 8.804 ± 0.026 |
1.572 ± 0.012 | 2.126 ± 0.012 |
Most of the basic statistics you can see at this page can be downloaded from this CSV file
See this proteome in:

Proteome-pI is available under Creative Commons Attribution-NoDerivs license, for more details see here
| Reference: Kozlowski LP. Proteome-pI 2.0: Proteome Isoelectric Point Database Update. Nucleic Acids Res. 2021, doi: 10.1093/nar/gkab944 | Contact: Lukasz P. Kozlowski |