Miniimonas sp. PCH200
Taxonomy: cellular organisms; Bacteria; Terrabacteria group; Actinobacteria; Actinomycetia; Micrococcales; Beutenbergiaceae; Serinibacter
Average proteome isoelectric point is 5.97
Get precalculated fractions of proteins
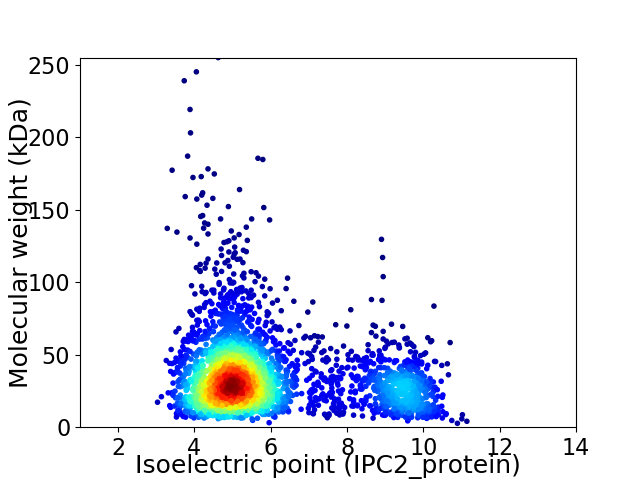
Virtual 2D-PAGE plot for 3302 proteins (isoelectric point calculated using IPC2_protein)
Get csv file with sequences according to given criteria:
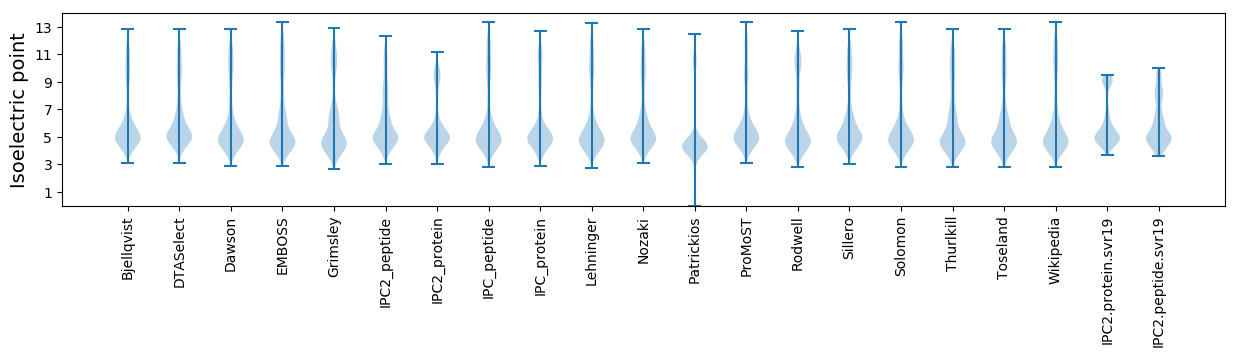
* You can choose from 21 different methods for calculating isoelectric point
Summary statistics related to proteome-wise predictions
Protein with the lowest isoelectric point:
>tr|A0A2U1ZWH3|A0A2U1ZWH3_9MICO OLD family endonuclease OS=Miniimonas sp. PCH200 OX=2135789 GN=C8046_12275 PE=4 SV=1
MM1 pKa = 7.25RR2 pKa = 11.84TSPTATATLALACTLALAACSPAVDD27 pKa = 5.0DD28 pKa = 5.67GGATPALPPTSGPFDD43 pKa = 3.76YY44 pKa = 11.0QLGEE48 pKa = 4.14PYY50 pKa = 10.92GEE52 pKa = 4.11AGEE55 pKa = 4.19FAVVGRR61 pKa = 11.84DD62 pKa = 3.4VTADD66 pKa = 3.81PLEE69 pKa = 4.39GAYY72 pKa = 9.71NVCYY76 pKa = 10.77LNGFQTQPGALTSWEE91 pKa = 4.54DD92 pKa = 3.55EE93 pKa = 4.47HH94 pKa = 8.49PDD96 pKa = 3.15ALLRR100 pKa = 11.84EE101 pKa = 4.59DD102 pKa = 4.33GALVMDD108 pKa = 5.65PDD110 pKa = 3.91WPDD113 pKa = 3.25EE114 pKa = 4.05AVLDD118 pKa = 4.28PTTPDD123 pKa = 2.88QRR125 pKa = 11.84EE126 pKa = 4.06AILAVVGPQIDD137 pKa = 3.57TCAEE141 pKa = 3.89KK142 pKa = 11.03GFDD145 pKa = 4.87AVEE148 pKa = 4.28LDD150 pKa = 3.85NLDD153 pKa = 3.3TFLRR157 pKa = 11.84FDD159 pKa = 3.4GVARR163 pKa = 11.84EE164 pKa = 4.15GALALASEE172 pKa = 4.94YY173 pKa = 10.89VGRR176 pKa = 11.84AHH178 pKa = 7.92DD179 pKa = 4.37AGLAVGQKK187 pKa = 9.39NAADD191 pKa = 3.44VGEE194 pKa = 4.43AARR197 pKa = 11.84EE198 pKa = 3.71EE199 pKa = 4.29AGFDD203 pKa = 3.37FAVVEE208 pKa = 4.48EE209 pKa = 4.35CAVYY213 pKa = 10.28DD214 pKa = 3.24EE215 pKa = 5.03CGAYY219 pKa = 9.77RR220 pKa = 11.84EE221 pKa = 4.52VYY223 pKa = 10.12GEE225 pKa = 4.1HH226 pKa = 6.23VLQIEE231 pKa = 4.4YY232 pKa = 10.9SDD234 pKa = 4.01TLDD237 pKa = 4.63DD238 pKa = 5.62ALTFDD243 pKa = 5.36DD244 pKa = 4.65VCADD248 pKa = 3.93PDD250 pKa = 3.9RR251 pKa = 11.84APLTVLRR258 pKa = 11.84DD259 pKa = 3.65RR260 pKa = 11.84LLVGSDD266 pKa = 3.59SPDD269 pKa = 3.24HH270 pKa = 6.71EE271 pKa = 5.29RR272 pKa = 11.84EE273 pKa = 3.9QCPP276 pKa = 3.29
MM1 pKa = 7.25RR2 pKa = 11.84TSPTATATLALACTLALAACSPAVDD27 pKa = 5.0DD28 pKa = 5.67GGATPALPPTSGPFDD43 pKa = 3.76YY44 pKa = 11.0QLGEE48 pKa = 4.14PYY50 pKa = 10.92GEE52 pKa = 4.11AGEE55 pKa = 4.19FAVVGRR61 pKa = 11.84DD62 pKa = 3.4VTADD66 pKa = 3.81PLEE69 pKa = 4.39GAYY72 pKa = 9.71NVCYY76 pKa = 10.77LNGFQTQPGALTSWEE91 pKa = 4.54DD92 pKa = 3.55EE93 pKa = 4.47HH94 pKa = 8.49PDD96 pKa = 3.15ALLRR100 pKa = 11.84EE101 pKa = 4.59DD102 pKa = 4.33GALVMDD108 pKa = 5.65PDD110 pKa = 3.91WPDD113 pKa = 3.25EE114 pKa = 4.05AVLDD118 pKa = 4.28PTTPDD123 pKa = 2.88QRR125 pKa = 11.84EE126 pKa = 4.06AILAVVGPQIDD137 pKa = 3.57TCAEE141 pKa = 3.89KK142 pKa = 11.03GFDD145 pKa = 4.87AVEE148 pKa = 4.28LDD150 pKa = 3.85NLDD153 pKa = 3.3TFLRR157 pKa = 11.84FDD159 pKa = 3.4GVARR163 pKa = 11.84EE164 pKa = 4.15GALALASEE172 pKa = 4.94YY173 pKa = 10.89VGRR176 pKa = 11.84AHH178 pKa = 7.92DD179 pKa = 4.37AGLAVGQKK187 pKa = 9.39NAADD191 pKa = 3.44VGEE194 pKa = 4.43AARR197 pKa = 11.84EE198 pKa = 3.71EE199 pKa = 4.29AGFDD203 pKa = 3.37FAVVEE208 pKa = 4.48EE209 pKa = 4.35CAVYY213 pKa = 10.28DD214 pKa = 3.24EE215 pKa = 5.03CGAYY219 pKa = 9.77RR220 pKa = 11.84EE221 pKa = 4.52VYY223 pKa = 10.12GEE225 pKa = 4.1HH226 pKa = 6.23VLQIEE231 pKa = 4.4YY232 pKa = 10.9SDD234 pKa = 4.01TLDD237 pKa = 4.63DD238 pKa = 5.62ALTFDD243 pKa = 5.36DD244 pKa = 4.65VCADD248 pKa = 3.93PDD250 pKa = 3.9RR251 pKa = 11.84APLTVLRR258 pKa = 11.84DD259 pKa = 3.65RR260 pKa = 11.84LLVGSDD266 pKa = 3.59SPDD269 pKa = 3.24HH270 pKa = 6.71EE271 pKa = 5.29RR272 pKa = 11.84EE273 pKa = 3.9QCPP276 pKa = 3.29
Molecular weight: 29.36 kDa
Isoelectric point according different methods:
Protein with the highest isoelectric point:
>tr|A0A2U1ZUG1|A0A2U1ZUG1_9MICO DUF3048 domain-containing protein OS=Miniimonas sp. PCH200 OX=2135789 GN=C8046_07755 PE=4 SV=1
MM1 pKa = 7.4GSVIKK6 pKa = 10.42KK7 pKa = 8.47RR8 pKa = 11.84RR9 pKa = 11.84KK10 pKa = 9.22RR11 pKa = 11.84MAKK14 pKa = 9.41KK15 pKa = 9.87KK16 pKa = 9.7HH17 pKa = 5.84RR18 pKa = 11.84KK19 pKa = 8.56LLRR22 pKa = 11.84KK23 pKa = 7.78TRR25 pKa = 11.84HH26 pKa = 3.65QRR28 pKa = 11.84RR29 pKa = 11.84NKK31 pKa = 9.78KK32 pKa = 9.85
MM1 pKa = 7.4GSVIKK6 pKa = 10.42KK7 pKa = 8.47RR8 pKa = 11.84RR9 pKa = 11.84KK10 pKa = 9.22RR11 pKa = 11.84MAKK14 pKa = 9.41KK15 pKa = 9.87KK16 pKa = 9.7HH17 pKa = 5.84RR18 pKa = 11.84KK19 pKa = 8.56LLRR22 pKa = 11.84KK23 pKa = 7.78TRR25 pKa = 11.84HH26 pKa = 3.65QRR28 pKa = 11.84RR29 pKa = 11.84NKK31 pKa = 9.78KK32 pKa = 9.85
Molecular weight: 4.08 kDa
Isoelectric point according different methods:
Peptides (in silico digests for buttom-up proteomics)
Below you can find in silico digests of the whole proteome with Trypsin, Chymotrypsin, Trypsin+LysC, LysN, ArgC proteases suitable for different mass spec machines.| Try ESI |
 |
|---|
| ChTry ESI |
|
|---|
| ArgC ESI |
|
|---|
| LysN ESI |
|
|---|
| TryLysC ESI |
|
|---|
| Try MALDI |
|
|---|
| ChTry MALDI |
|
|---|
| ArgC MALDI |
|
|---|
| LysN MALDI |
|
|---|
| TryLysC MALDI |
|
|---|
| Try LTQ |
|
|---|
| ChTry LTQ |
|
|---|
| ArgC LTQ |
|
|---|
| LysN LTQ |
|
|---|
| TryLysC LTQ |
|
|---|
| Try MSlow |
|
|---|
| ChTry MSlow |
|
|---|
| ArgC MSlow |
|
|---|
| LysN MSlow |
|
|---|
| TryLysC MSlow |
|
|---|
| Try MShigh |
|
|---|
| ChTry MShigh |
|
|---|
| ArgC MShigh |
|
|---|
| LysN MShigh |
|
|---|
| TryLysC MShigh |
|
|---|
General Statistics
Number of major isoforms |
Number of additional isoforms |
Number of all proteins |
Number of amino acids |
Min. Seq. Length |
Max. Seq. Length |
Avg. Seq. Length |
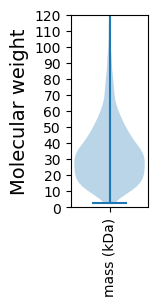
Avg. Mol. Weight |
|---|---|---|---|---|---|---|---|
0 |
1140190 |
24 |
2464 |
345.3 |
36.51 |
Amino acid frequency
Ala |
Cys |
Asp |
Glu |
Phe |
Gly |
His |
Ile |
Lys |
Leu |
|---|---|---|---|---|---|---|---|---|---|
14.146 ± 0.067 | 0.509 ± 0.009 |
6.287 ± 0.038 | 5.56 ± 0.042 |
2.558 ± 0.026 | 9.481 ± 0.044 |
2.007 ± 0.023 | 3.321 ± 0.03 |
1.263 ± 0.025 | 10.193 ± 0.053 |
Met |
Asn |
Gln |
Pro |
Arg |
Ser |
Thr |
Val |
Trp |
Tyr |
|---|---|---|---|---|---|---|---|---|---|
1.516 ± 0.015 | 1.616 ± 0.028 |
6.033 ± 0.034 | 2.503 ± 0.023 |
7.49 ± 0.056 | 5.469 ± 0.03 |
6.819 ± 0.057 | 9.896 ± 0.049 |
1.548 ± 0.019 | 1.785 ± 0.023 |
Most of the basic statistics you can see at this page can be downloaded from this CSV file
See this proteome in:

Proteome-pI is available under Creative Commons Attribution-NoDerivs license, for more details see here
| Reference: Kozlowski LP. Proteome-pI 2.0: Proteome Isoelectric Point Database Update. Nucleic Acids Res. 2021, doi: 10.1093/nar/gkab944 | Contact: Lukasz P. Kozlowski |