Pectobacterium phage Jarilo
Taxonomy: Viruses; Duplodnaviria; Heunggongvirae; Uroviricota; Caudoviricetes; Caudovirales; Autographiviridae; Studiervirinae; Jarilovirus; Pectobacterium virus Jarilo
Average proteome isoelectric point is 6.58
Get precalculated fractions of proteins
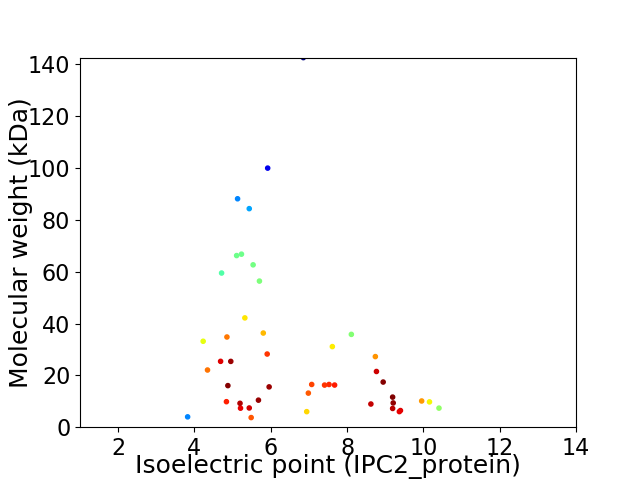
Virtual 2D-PAGE plot for 46 proteins (isoelectric point calculated using IPC2_protein)
Get csv file with sequences according to given criteria:
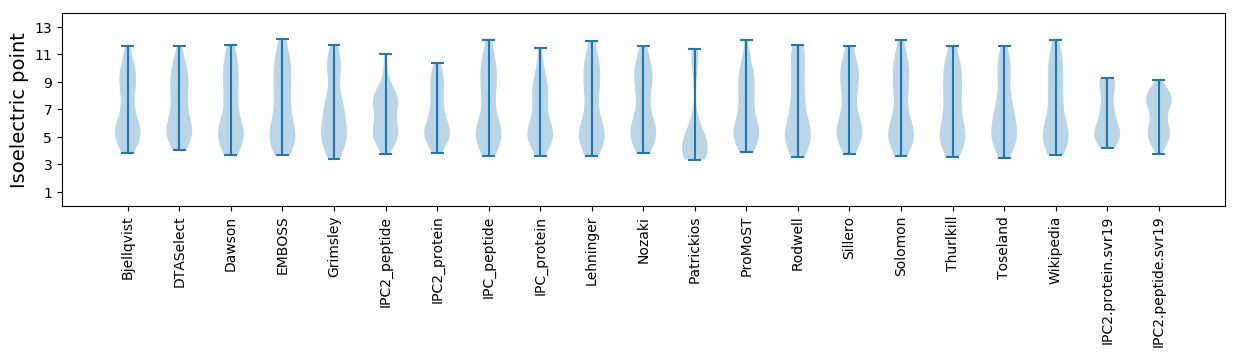
* You can choose from 21 different methods for calculating isoelectric point
Summary statistics related to proteome-wise predictions
Protein with the lowest isoelectric point:
>tr|A0A2S1GSX8|A0A2S1GSX8_9CAUD Endonuclease OS=Pectobacterium phage Jarilo OX=2163634 PE=4 SV=1
MM1 pKa = 7.23TPLEE5 pKa = 4.25IMLSLVLTLIIGYY18 pKa = 9.81KK19 pKa = 7.74IGKK22 pKa = 8.63YY23 pKa = 8.64VAEE26 pKa = 5.53DD27 pKa = 4.35DD28 pKa = 5.72DD29 pKa = 7.0DD30 pKa = 5.63DD31 pKa = 5.55FPFLL35 pKa = 4.53
MM1 pKa = 7.23TPLEE5 pKa = 4.25IMLSLVLTLIIGYY18 pKa = 9.81KK19 pKa = 7.74IGKK22 pKa = 8.63YY23 pKa = 8.64VAEE26 pKa = 5.53DD27 pKa = 4.35DD28 pKa = 5.72DD29 pKa = 7.0DD30 pKa = 5.63DD31 pKa = 5.55FPFLL35 pKa = 4.53
Molecular weight: 3.99 kDa
Isoelectric point according different methods:
Protein with the highest isoelectric point:
>tr|A0A2S1GSX7|A0A2S1GSX7_9CAUD Uncharacterized protein OS=Pectobacterium phage Jarilo OX=2163634 PE=4 SV=1
MM1 pKa = 7.46IALLMVASYY10 pKa = 11.31SLIIGLFVRR19 pKa = 11.84DD20 pKa = 5.01FIKK23 pKa = 10.67GLKK26 pKa = 7.44VHH28 pKa = 6.98KK29 pKa = 9.65ATLSYY34 pKa = 10.69RR35 pKa = 11.84LYY37 pKa = 10.68GVVPRR42 pKa = 11.84FTVRR46 pKa = 11.84LTNGRR51 pKa = 11.84FKK53 pKa = 11.1ANKK56 pKa = 9.12VGVFYY61 pKa = 11.11VATHH65 pKa = 6.31
MM1 pKa = 7.46IALLMVASYY10 pKa = 11.31SLIIGLFVRR19 pKa = 11.84DD20 pKa = 5.01FIKK23 pKa = 10.67GLKK26 pKa = 7.44VHH28 pKa = 6.98KK29 pKa = 9.65ATLSYY34 pKa = 10.69RR35 pKa = 11.84LYY37 pKa = 10.68GVVPRR42 pKa = 11.84FTVRR46 pKa = 11.84LTNGRR51 pKa = 11.84FKK53 pKa = 11.1ANKK56 pKa = 9.12VGVFYY61 pKa = 11.11VATHH65 pKa = 6.31
Molecular weight: 7.36 kDa
Isoelectric point according different methods:
Peptides (in silico digests for buttom-up proteomics)
Below you can find in silico digests of the whole proteome with Trypsin, Chymotrypsin, Trypsin+LysC, LysN, ArgC proteases suitable for different mass spec machines.| Try ESI |
 |
|---|
| ChTry ESI |
|
|---|
| ArgC ESI |
|
|---|
| LysN ESI |
|
|---|
| TryLysC ESI |
|
|---|
| Try MALDI |
|
|---|
| ChTry MALDI |
|
|---|
| ArgC MALDI |
|
|---|
| LysN MALDI |
|
|---|
| TryLysC MALDI |
|
|---|
| Try LTQ |
|
|---|
| ChTry LTQ |
|
|---|
| ArgC LTQ |
|
|---|
| LysN LTQ |
|
|---|
| TryLysC LTQ |
|
|---|
| Try MSlow |
|
|---|
| ChTry MSlow |
|
|---|
| ArgC MSlow |
|
|---|
| LysN MSlow |
|
|---|
| TryLysC MSlow |
|
|---|
| Try MShigh |
|
|---|
| ChTry MShigh |
|
|---|
| ArgC MShigh |
|
|---|
| LysN MShigh |
|
|---|
| TryLysC MShigh |
|
|---|
General Statistics
Number of major isoforms |
Number of additional isoforms |
Number of all proteins |
Number of amino acids |
Min. Seq. Length |
Max. Seq. Length |
Avg. Seq. Length |
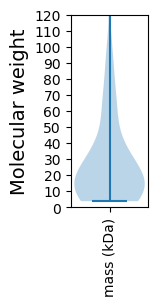
Avg. Mol. Weight |
|---|---|---|---|---|---|---|---|
0 |
12192 |
33 |
1327 |
265.0 |
29.39 |
Amino acid frequency
Ala |
Cys |
Asp |
Glu |
Phe |
Gly |
His |
Ile |
Lys |
Leu |
|---|---|---|---|---|---|---|---|---|---|
9.662 ± 0.427 | 0.853 ± 0.16 |
6.389 ± 0.221 | 6.078 ± 0.303 |
3.642 ± 0.187 | 7.292 ± 0.325 |
1.878 ± 0.176 | 5.077 ± 0.167 |
6.217 ± 0.316 | 8.407 ± 0.3 |
Met |
Asn |
Gln |
Pro |
Arg |
Ser |
Thr |
Val |
Trp |
Tyr |
|---|---|---|---|---|---|---|---|---|---|
2.781 ± 0.154 | 4.429 ± 0.182 |
3.74 ± 0.185 | 4.454 ± 0.287 |
5.192 ± 0.185 | 6.406 ± 0.328 |
6.094 ± 0.305 | 6.709 ± 0.261 |
1.46 ± 0.185 | 3.24 ± 0.153 |
Most of the basic statistics you can see at this page can be downloaded from this CSV file
See this proteome in:

Proteome-pI is available under Creative Commons Attribution-NoDerivs license, for more details see here
| Reference: Kozlowski LP. Proteome-pI 2.0: Proteome Isoelectric Point Database Update. Nucleic Acids Res. 2021, doi: 10.1093/nar/gkab944 | Contact: Lukasz P. Kozlowski |