Zhengella mangrovi
Taxonomy: cellular organisms; Bacteria; Proteobacteria; Alphaproteobacteria; Hyphomicrobiales; Phyllobacteriaceae; Zhengella
Average proteome isoelectric point is 6.36
Get precalculated fractions of proteins
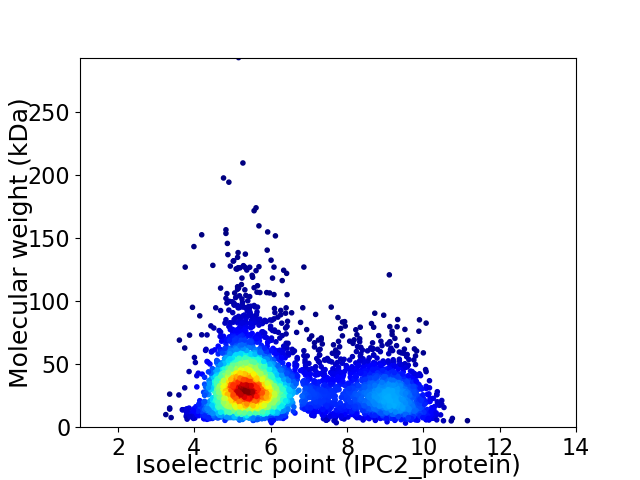
Virtual 2D-PAGE plot for 4686 proteins (isoelectric point calculated using IPC2_protein)
Get csv file with sequences according to given criteria:
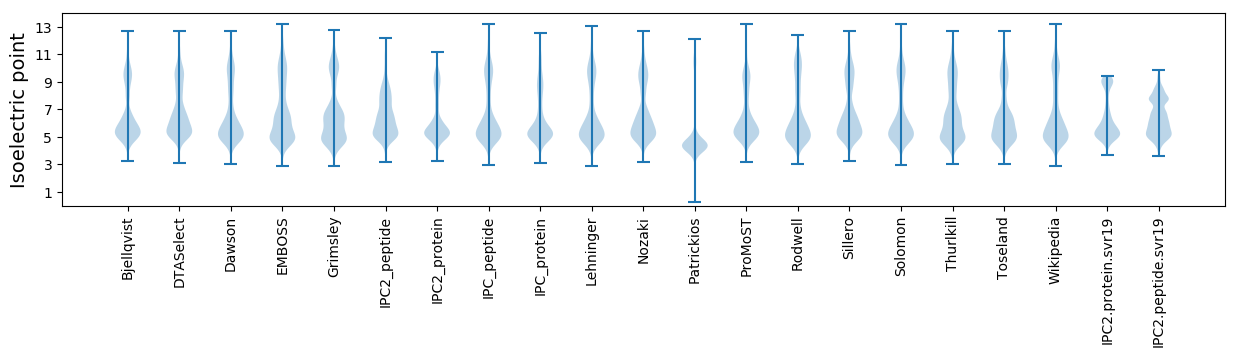
* You can choose from 21 different methods for calculating isoelectric point
Summary statistics related to proteome-wise predictions
Protein with the lowest isoelectric point:
>tr|A0A2G1QGF1|A0A2G1QGF1_9RHIZ Uncharacterized protein (Fragment) OS=Zhengella mangrovi OX=1982044 GN=CSC94_23945 PE=3 SV=1
MM1 pKa = 8.22RR2 pKa = 11.84IPCKK6 pKa = 10.09AWRR9 pKa = 11.84KK10 pKa = 9.91AILCVVTALGVFQAEE25 pKa = 4.48SSAVAADD32 pKa = 3.87TCTSAPTTFNTATGRR47 pKa = 11.84VTDD50 pKa = 3.96GTYY53 pKa = 10.21SASYY57 pKa = 9.84SYY59 pKa = 11.14SILQSAGYY67 pKa = 9.49GAATPAGADD76 pKa = 3.57GLVLDD81 pKa = 4.72VANGAANPDD90 pKa = 4.54SITVRR95 pKa = 11.84YY96 pKa = 8.57NVSGVTSPGHH106 pKa = 5.65VIRR109 pKa = 11.84LVGGSFNTVNGDD121 pKa = 3.38NAASDD126 pKa = 4.15YY127 pKa = 9.94TISWTGGTGSATWYY141 pKa = 10.51DD142 pKa = 3.82PATPDD147 pKa = 2.87VTMYY151 pKa = 10.42RR152 pKa = 11.84WAPPAGFDD160 pKa = 3.23INEE163 pKa = 4.05RR164 pKa = 11.84QIEE167 pKa = 4.21GLGTSGTLANGGTIRR182 pKa = 11.84VYY184 pKa = 10.71DD185 pKa = 3.44VSNAVTEE192 pKa = 4.64WYY194 pKa = 10.68VDD196 pKa = 3.8LPRR199 pKa = 11.84GATSVTVSKK208 pKa = 11.01VVLHH212 pKa = 6.79GGTSATTGIDD222 pKa = 3.45FQYY225 pKa = 10.45PALGYY230 pKa = 9.94GSSGSGTSFRR240 pKa = 11.84EE241 pKa = 4.06WIAFDD246 pKa = 3.67TLLCRR251 pKa = 11.84DD252 pKa = 3.66TDD254 pKa = 4.04LVTVKK259 pKa = 9.83TLEE262 pKa = 4.42SGNATPSVGDD272 pKa = 3.43TVGFRR277 pKa = 11.84INVVNNGPDD286 pKa = 3.05AATNVALTDD295 pKa = 3.62QVPAGLTFVSATPGAGGYY313 pKa = 9.46DD314 pKa = 3.51AATGIWTIGTLANGASASLVLTATVNADD342 pKa = 3.1QGGQGITNTTTPAAGDD358 pKa = 3.35QGDD361 pKa = 4.25PSTAGDD367 pKa = 4.54DD368 pKa = 3.69LTEE371 pKa = 5.41SIMVLAQPDD380 pKa = 4.1LVTVKK385 pKa = 10.8SLLSANATPAVGDD398 pKa = 3.89SVTFRR403 pKa = 11.84LMVTNATAGVTATGVSLNDD422 pKa = 3.41QMPVGLTYY430 pKa = 10.8ASHH433 pKa = 5.94VASAGTYY440 pKa = 10.53DD441 pKa = 4.03PATGAWTIGSVVNGTPATLDD461 pKa = 2.9ITATVDD467 pKa = 3.57AGQQGNLITNTATPATGDD485 pKa = 3.46QPDD488 pKa = 3.93PSMLGDD494 pKa = 4.39DD495 pKa = 4.17LMEE498 pKa = 4.44SVTVFNPQPALVLAKK513 pKa = 8.86TWSFVTDD520 pKa = 3.64ANGDD524 pKa = 3.83GKK526 pKa = 10.79AGTGDD531 pKa = 3.62VVRR534 pKa = 11.84YY535 pKa = 9.48AYY537 pKa = 10.48AVTNTGNVNVANVSVSDD554 pKa = 3.71TTNGNDD560 pKa = 3.41PAFLGGASPGQPVAVSLTTDD580 pKa = 2.98AGTVGDD586 pKa = 4.84STDD589 pKa = 3.73ADD591 pKa = 3.62NAGPVWDD598 pKa = 4.55TLAPGDD604 pKa = 4.24TVTFTADD611 pKa = 3.42YY612 pKa = 10.79SVVQADD618 pKa = 3.33VDD620 pKa = 3.88ALQQ623 pKa = 3.87
MM1 pKa = 8.22RR2 pKa = 11.84IPCKK6 pKa = 10.09AWRR9 pKa = 11.84KK10 pKa = 9.91AILCVVTALGVFQAEE25 pKa = 4.48SSAVAADD32 pKa = 3.87TCTSAPTTFNTATGRR47 pKa = 11.84VTDD50 pKa = 3.96GTYY53 pKa = 10.21SASYY57 pKa = 9.84SYY59 pKa = 11.14SILQSAGYY67 pKa = 9.49GAATPAGADD76 pKa = 3.57GLVLDD81 pKa = 4.72VANGAANPDD90 pKa = 4.54SITVRR95 pKa = 11.84YY96 pKa = 8.57NVSGVTSPGHH106 pKa = 5.65VIRR109 pKa = 11.84LVGGSFNTVNGDD121 pKa = 3.38NAASDD126 pKa = 4.15YY127 pKa = 9.94TISWTGGTGSATWYY141 pKa = 10.51DD142 pKa = 3.82PATPDD147 pKa = 2.87VTMYY151 pKa = 10.42RR152 pKa = 11.84WAPPAGFDD160 pKa = 3.23INEE163 pKa = 4.05RR164 pKa = 11.84QIEE167 pKa = 4.21GLGTSGTLANGGTIRR182 pKa = 11.84VYY184 pKa = 10.71DD185 pKa = 3.44VSNAVTEE192 pKa = 4.64WYY194 pKa = 10.68VDD196 pKa = 3.8LPRR199 pKa = 11.84GATSVTVSKK208 pKa = 11.01VVLHH212 pKa = 6.79GGTSATTGIDD222 pKa = 3.45FQYY225 pKa = 10.45PALGYY230 pKa = 9.94GSSGSGTSFRR240 pKa = 11.84EE241 pKa = 4.06WIAFDD246 pKa = 3.67TLLCRR251 pKa = 11.84DD252 pKa = 3.66TDD254 pKa = 4.04LVTVKK259 pKa = 9.83TLEE262 pKa = 4.42SGNATPSVGDD272 pKa = 3.43TVGFRR277 pKa = 11.84INVVNNGPDD286 pKa = 3.05AATNVALTDD295 pKa = 3.62QVPAGLTFVSATPGAGGYY313 pKa = 9.46DD314 pKa = 3.51AATGIWTIGTLANGASASLVLTATVNADD342 pKa = 3.1QGGQGITNTTTPAAGDD358 pKa = 3.35QGDD361 pKa = 4.25PSTAGDD367 pKa = 4.54DD368 pKa = 3.69LTEE371 pKa = 5.41SIMVLAQPDD380 pKa = 4.1LVTVKK385 pKa = 10.8SLLSANATPAVGDD398 pKa = 3.89SVTFRR403 pKa = 11.84LMVTNATAGVTATGVSLNDD422 pKa = 3.41QMPVGLTYY430 pKa = 10.8ASHH433 pKa = 5.94VASAGTYY440 pKa = 10.53DD441 pKa = 4.03PATGAWTIGSVVNGTPATLDD461 pKa = 2.9ITATVDD467 pKa = 3.57AGQQGNLITNTATPATGDD485 pKa = 3.46QPDD488 pKa = 3.93PSMLGDD494 pKa = 4.39DD495 pKa = 4.17LMEE498 pKa = 4.44SVTVFNPQPALVLAKK513 pKa = 8.86TWSFVTDD520 pKa = 3.64ANGDD524 pKa = 3.83GKK526 pKa = 10.79AGTGDD531 pKa = 3.62VVRR534 pKa = 11.84YY535 pKa = 9.48AYY537 pKa = 10.48AVTNTGNVNVANVSVSDD554 pKa = 3.71TTNGNDD560 pKa = 3.41PAFLGGASPGQPVAVSLTTDD580 pKa = 2.98AGTVGDD586 pKa = 4.84STDD589 pKa = 3.73ADD591 pKa = 3.62NAGPVWDD598 pKa = 4.55TLAPGDD604 pKa = 4.24TVTFTADD611 pKa = 3.42YY612 pKa = 10.79SVVQADD618 pKa = 3.33VDD620 pKa = 3.88ALQQ623 pKa = 3.87
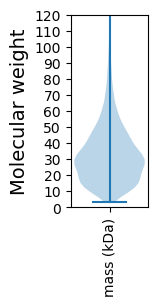
Molecular weight: 62.87 kDa
Isoelectric point according different methods:
Protein with the highest isoelectric point:
>tr|A0A2G1QHA3|A0A2G1QHA3_9RHIZ Uncharacterized protein OS=Zhengella mangrovi OX=1982044 GN=CSC94_22370 PE=4 SV=1
MM1 pKa = 7.35KK2 pKa = 9.43RR3 pKa = 11.84TYY5 pKa = 10.27QPSKK9 pKa = 9.73LVRR12 pKa = 11.84KK13 pKa = 8.95RR14 pKa = 11.84RR15 pKa = 11.84HH16 pKa = 4.63GFRR19 pKa = 11.84SRR21 pKa = 11.84MATKK25 pKa = 10.47GGRR28 pKa = 11.84KK29 pKa = 9.23VIAARR34 pKa = 11.84RR35 pKa = 11.84NRR37 pKa = 11.84GRR39 pKa = 11.84ARR41 pKa = 11.84LSAA44 pKa = 3.99
MM1 pKa = 7.35KK2 pKa = 9.43RR3 pKa = 11.84TYY5 pKa = 10.27QPSKK9 pKa = 9.73LVRR12 pKa = 11.84KK13 pKa = 8.95RR14 pKa = 11.84RR15 pKa = 11.84HH16 pKa = 4.63GFRR19 pKa = 11.84SRR21 pKa = 11.84MATKK25 pKa = 10.47GGRR28 pKa = 11.84KK29 pKa = 9.23VIAARR34 pKa = 11.84RR35 pKa = 11.84NRR37 pKa = 11.84GRR39 pKa = 11.84ARR41 pKa = 11.84LSAA44 pKa = 3.99
Molecular weight: 5.17 kDa
Isoelectric point according different methods:
Peptides (in silico digests for buttom-up proteomics)
Below you can find in silico digests of the whole proteome with Trypsin, Chymotrypsin, Trypsin+LysC, LysN, ArgC proteases suitable for different mass spec machines.| Try ESI |
 |
|---|
| ChTry ESI |
|
|---|
| ArgC ESI |
|
|---|
| LysN ESI |
|
|---|
| TryLysC ESI |
|
|---|
| Try MALDI |
|
|---|
| ChTry MALDI |
|
|---|
| ArgC MALDI |
|
|---|
| LysN MALDI |
|
|---|
| TryLysC MALDI |
|
|---|
| Try LTQ |
|
|---|
| ChTry LTQ |
|
|---|
| ArgC LTQ |
|
|---|
| LysN LTQ |
|
|---|
| TryLysC LTQ |
|
|---|
| Try MSlow |
|
|---|
| ChTry MSlow |
|
|---|
| ArgC MSlow |
|
|---|
| LysN MSlow |
|
|---|
| TryLysC MSlow |
|
|---|
| Try MShigh |
|
|---|
| ChTry MShigh |
|
|---|
| ArgC MShigh |
|
|---|
| LysN MShigh |
|
|---|
| TryLysC MShigh |
|
|---|
General Statistics
Number of major isoforms |
Number of additional isoforms |
Number of all proteins |
Number of amino acids |
Min. Seq. Length |
Max. Seq. Length |
Avg. Seq. Length |
Avg. Mol. Weight |
|---|---|---|---|---|---|---|---|
0 |
1491495 |
29 |
2686 |
318.3 |
34.46 |
Amino acid frequency
Ala |
Cys |
Asp |
Glu |
Phe |
Gly |
His |
Ile |
Lys |
Leu |
|---|---|---|---|---|---|---|---|---|---|
12.742 ± 0.056 | 0.86 ± 0.012 |
5.979 ± 0.032 | 5.641 ± 0.031 |
3.808 ± 0.022 | 8.909 ± 0.035 |
2.057 ± 0.018 | 5.205 ± 0.026 |
3.205 ± 0.028 | 9.696 ± 0.037 |
Met |
Asn |
Gln |
Pro |
Arg |
Ser |
Thr |
Val |
Trp |
Tyr |
|---|---|---|---|---|---|---|---|---|---|
2.796 ± 0.018 | 2.591 ± 0.02 |
5.057 ± 0.025 | 2.871 ± 0.017 |
7.098 ± 0.041 | 5.265 ± 0.026 |
5.329 ± 0.03 | 7.384 ± 0.026 |
1.333 ± 0.014 | 2.176 ± 0.02 |
Most of the basic statistics you can see at this page can be downloaded from this CSV file
See this proteome in:

Proteome-pI is available under Creative Commons Attribution-NoDerivs license, for more details see here
| Reference: Kozlowski LP. Proteome-pI 2.0: Proteome Isoelectric Point Database Update. Nucleic Acids Res. 2021, doi: 10.1093/nar/gkab944 | Contact: Lukasz P. Kozlowski |