Nitrospira lenta
Taxonomy: cellular organisms; Bacteria; Nitrospirae; Nitrospira; Nitrospirales; Nitrospiraceae; Nitrospira
Average proteome isoelectric point is 6.89
Get precalculated fractions of proteins
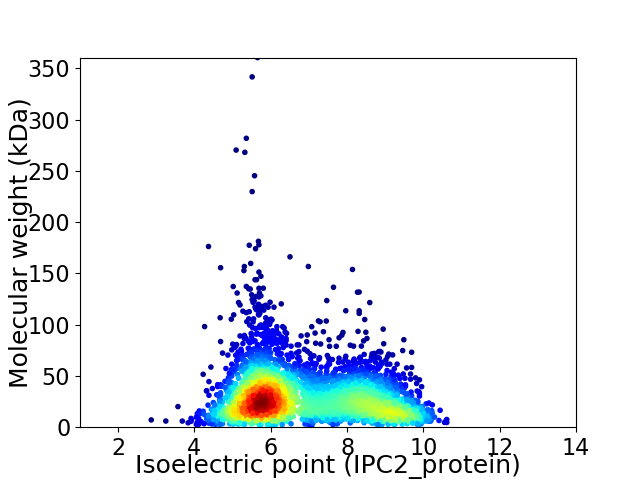
Virtual 2D-PAGE plot for 3885 proteins (isoelectric point calculated using IPC2_protein)
Get csv file with sequences according to given criteria:
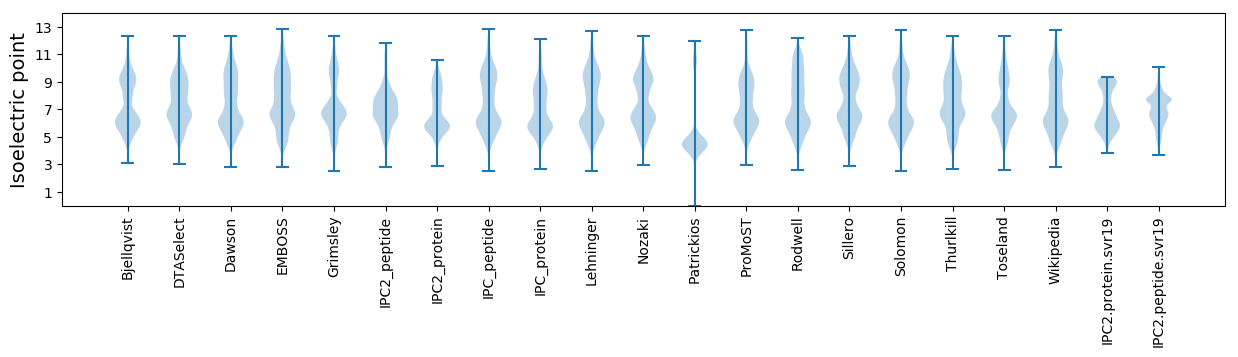
* You can choose from 21 different methods for calculating isoelectric point
Summary statistics related to proteome-wise predictions
Protein with the lowest isoelectric point:
>tr|A0A330L957|A0A330L957_9BACT Elongation factor G (EF-G) OS=Nitrospira lenta OX=1436998 GN=fusA PE=3 SV=1
MM1 pKa = 8.19RR2 pKa = 11.84YY3 pKa = 9.9LFLPSDD9 pKa = 3.81MLDD12 pKa = 3.57DD13 pKa = 4.69LGVVVLVIFYY23 pKa = 10.83
MM1 pKa = 8.19RR2 pKa = 11.84YY3 pKa = 9.9LFLPSDD9 pKa = 3.81MLDD12 pKa = 3.57DD13 pKa = 4.69LGVVVLVIFYY23 pKa = 10.83
Molecular weight: 2.72 kDa
Isoelectric point according different methods:
Protein with the highest isoelectric point:
>tr|A0A330LBJ5|A0A330LBJ5_9BACT Uncharacterized protein OS=Nitrospira lenta OX=1436998 GN=NITLEN_70056 PE=4 SV=1
MM1 pKa = 7.59LPRR4 pKa = 11.84VAKK7 pKa = 10.06AVPRR11 pKa = 11.84QEE13 pKa = 3.72PRR15 pKa = 11.84VFQSLRR21 pKa = 11.84IGLASLTKK29 pKa = 9.85RR30 pKa = 11.84WKK32 pKa = 9.68EE33 pKa = 3.67SQGAGKK39 pKa = 9.54QCAATAHH46 pKa = 6.64AIIALVPEE54 pKa = 4.45PPGLRR59 pKa = 11.84VIEE62 pKa = 4.85GKK64 pKa = 10.72LSTASYY70 pKa = 9.41TYY72 pKa = 10.31VAPFPCPSITRR83 pKa = 11.84NRR85 pKa = 11.84RR86 pKa = 11.84SKK88 pKa = 11.08SSWIYY93 pKa = 9.59CARR96 pKa = 11.84SATARR101 pKa = 11.84VDD103 pKa = 3.92SNDD106 pKa = 2.93
MM1 pKa = 7.59LPRR4 pKa = 11.84VAKK7 pKa = 10.06AVPRR11 pKa = 11.84QEE13 pKa = 3.72PRR15 pKa = 11.84VFQSLRR21 pKa = 11.84IGLASLTKK29 pKa = 9.85RR30 pKa = 11.84WKK32 pKa = 9.68EE33 pKa = 3.67SQGAGKK39 pKa = 9.54QCAATAHH46 pKa = 6.64AIIALVPEE54 pKa = 4.45PPGLRR59 pKa = 11.84VIEE62 pKa = 4.85GKK64 pKa = 10.72LSTASYY70 pKa = 9.41TYY72 pKa = 10.31VAPFPCPSITRR83 pKa = 11.84NRR85 pKa = 11.84RR86 pKa = 11.84SKK88 pKa = 11.08SSWIYY93 pKa = 9.59CARR96 pKa = 11.84SATARR101 pKa = 11.84VDD103 pKa = 3.92SNDD106 pKa = 2.93
Molecular weight: 11.61 kDa
Isoelectric point according different methods:
Peptides (in silico digests for buttom-up proteomics)
Below you can find in silico digests of the whole proteome with Trypsin, Chymotrypsin, Trypsin+LysC, LysN, ArgC proteases suitable for different mass spec machines.| Try ESI |
 |
|---|
| ChTry ESI |
|
|---|
| ArgC ESI |
|
|---|
| LysN ESI |
|
|---|
| TryLysC ESI |
|
|---|
| Try MALDI |
|
|---|
| ChTry MALDI |
|
|---|
| ArgC MALDI |
|
|---|
| LysN MALDI |
|
|---|
| TryLysC MALDI |
|
|---|
| Try LTQ |
|
|---|
| ChTry LTQ |
|
|---|
| ArgC LTQ |
|
|---|
| LysN LTQ |
|
|---|
| TryLysC LTQ |
|
|---|
| Try MSlow |
|
|---|
| ChTry MSlow |
|
|---|
| ArgC MSlow |
|
|---|
| LysN MSlow |
|
|---|
| TryLysC MSlow |
|
|---|
| Try MShigh |
|
|---|
| ChTry MShigh |
|
|---|
| ArgC MShigh |
|
|---|
| LysN MShigh |
|
|---|
| TryLysC MShigh |
|
|---|
General Statistics
Number of major isoforms |
Number of additional isoforms |
Number of all proteins |
Number of amino acids |
Min. Seq. Length |
Max. Seq. Length |
Avg. Seq. Length |
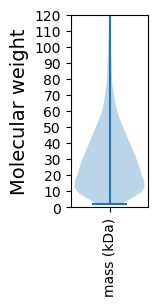
Avg. Mol. Weight |
|---|---|---|---|---|---|---|---|
0 |
1139029 |
16 |
3260 |
293.2 |
32.23 |
Amino acid frequency
Ala |
Cys |
Asp |
Glu |
Phe |
Gly |
His |
Ile |
Lys |
Leu |
|---|---|---|---|---|---|---|---|---|---|
10.062 ± 0.041 | 1.006 ± 0.014 |
5.114 ± 0.03 | 5.812 ± 0.04 |
3.546 ± 0.026 | 7.875 ± 0.04 |
2.377 ± 0.02 | 5.243 ± 0.031 |
4.037 ± 0.039 | 10.552 ± 0.046 |
Met |
Asn |
Gln |
Pro |
Arg |
Ser |
Thr |
Val |
Trp |
Tyr |
|---|---|---|---|---|---|---|---|---|---|
2.471 ± 0.019 | 2.63 ± 0.024 |
5.159 ± 0.034 | 4.102 ± 0.026 |
6.732 ± 0.041 | 5.955 ± 0.034 |
5.8 ± 0.037 | 7.677 ± 0.04 |
1.345 ± 0.02 | 2.505 ± 0.022 |
Most of the basic statistics you can see at this page can be downloaded from this CSV file
See this proteome in:

Proteome-pI is available under Creative Commons Attribution-NoDerivs license, for more details see here
| Reference: Kozlowski LP. Proteome-pI 2.0: Proteome Isoelectric Point Database Update. Nucleic Acids Res. 2021, doi: 10.1093/nar/gkab944 | Contact: Lukasz P. Kozlowski |