Enterococcus phage BC611
Taxonomy: Viruses; Duplodnaviria; Heunggongvirae; Uroviricota; Caudoviricetes; Caudovirales; Siphoviridae; Saphexavirus; Enterococcus virus BC611
Average proteome isoelectric point is 6.16
Get precalculated fractions of proteins
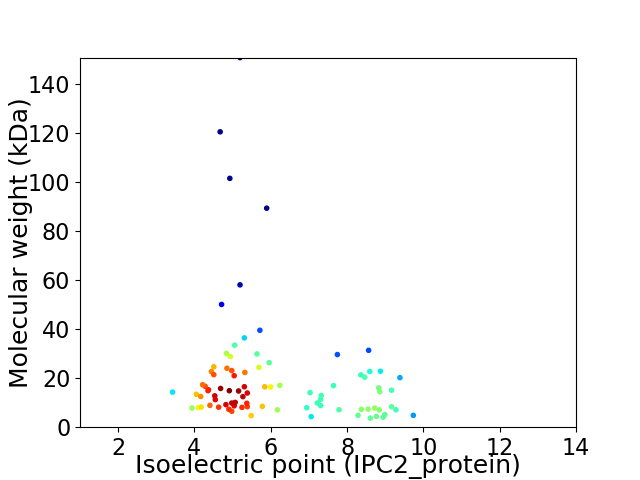
Virtual 2D-PAGE plot for 87 proteins (isoelectric point calculated using IPC2_protein)
Get csv file with sequences according to given criteria:
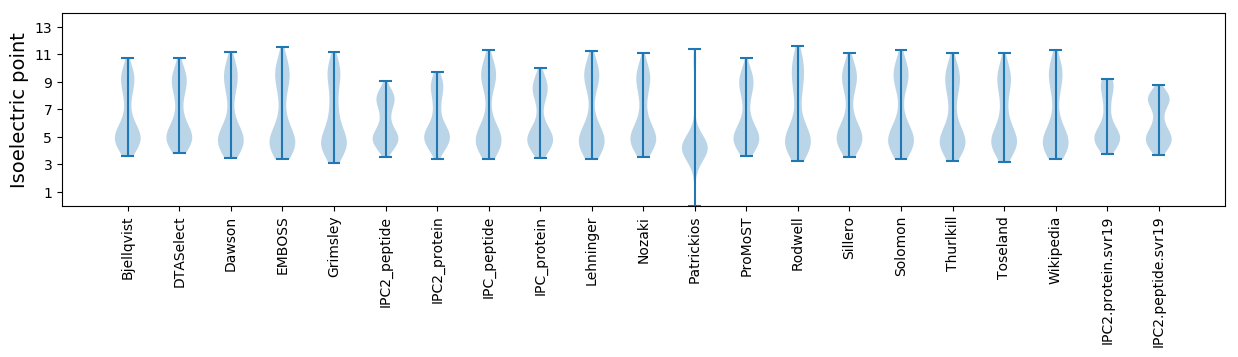
* You can choose from 21 different methods for calculating isoelectric point
Summary statistics related to proteome-wise predictions
Protein with the lowest isoelectric point:
>tr|K0IS72|K0IS72_9CAUD Uncharacterized protein OS=Enterococcus phage BC611 OX=1173135 PE=4 SV=1
MM1 pKa = 7.91IEE3 pKa = 4.22LFKK6 pKa = 11.43EE7 pKa = 3.93NLTLDD12 pKa = 3.64EE13 pKa = 5.54MSDD16 pKa = 2.78IWYY19 pKa = 9.05GWDD22 pKa = 4.22NEE24 pKa = 3.9GLLYY28 pKa = 10.6GWEE31 pKa = 3.94NGEE34 pKa = 4.07AGEE37 pKa = 4.79AYY39 pKa = 10.4ALLYY43 pKa = 10.03EE44 pKa = 4.79KK45 pKa = 10.14GYY47 pKa = 11.44NMDD50 pKa = 4.11SIKK53 pKa = 10.61VLHH56 pKa = 6.42EE57 pKa = 4.29AFDD60 pKa = 4.45TIGGLIGAII69 pKa = 3.72
MM1 pKa = 7.91IEE3 pKa = 4.22LFKK6 pKa = 11.43EE7 pKa = 3.93NLTLDD12 pKa = 3.64EE13 pKa = 5.54MSDD16 pKa = 2.78IWYY19 pKa = 9.05GWDD22 pKa = 4.22NEE24 pKa = 3.9GLLYY28 pKa = 10.6GWEE31 pKa = 3.94NGEE34 pKa = 4.07AGEE37 pKa = 4.79AYY39 pKa = 10.4ALLYY43 pKa = 10.03EE44 pKa = 4.79KK45 pKa = 10.14GYY47 pKa = 11.44NMDD50 pKa = 4.11SIKK53 pKa = 10.61VLHH56 pKa = 6.42EE57 pKa = 4.29AFDD60 pKa = 4.45TIGGLIGAII69 pKa = 3.72
Molecular weight: 7.84 kDa
Isoelectric point according different methods:
Protein with the highest isoelectric point:
>tr|K0IX54|K0IX54_9CAUD Uncharacterized protein OS=Enterococcus phage BC611 OX=1173135 PE=4 SV=1
MM1 pKa = 7.1NVEE4 pKa = 4.22SRR6 pKa = 11.84NSEE9 pKa = 4.24KK10 pKa = 10.57AWNRR14 pKa = 11.84AIVKK18 pKa = 8.88TEE20 pKa = 3.5QEE22 pKa = 3.9AAKK25 pKa = 10.67KK26 pKa = 10.42KK27 pKa = 8.64MEE29 pKa = 4.46RR30 pKa = 11.84LAKK33 pKa = 9.42MRR35 pKa = 11.84AKK37 pKa = 10.47AKK39 pKa = 10.39RR40 pKa = 11.84KK41 pKa = 9.4
MM1 pKa = 7.1NVEE4 pKa = 4.22SRR6 pKa = 11.84NSEE9 pKa = 4.24KK10 pKa = 10.57AWNRR14 pKa = 11.84AIVKK18 pKa = 8.88TEE20 pKa = 3.5QEE22 pKa = 3.9AAKK25 pKa = 10.67KK26 pKa = 10.42KK27 pKa = 8.64MEE29 pKa = 4.46RR30 pKa = 11.84LAKK33 pKa = 9.42MRR35 pKa = 11.84AKK37 pKa = 10.47AKK39 pKa = 10.39RR40 pKa = 11.84KK41 pKa = 9.4
Molecular weight: 4.85 kDa
Isoelectric point according different methods:
Peptides (in silico digests for buttom-up proteomics)
Below you can find in silico digests of the whole proteome with Trypsin, Chymotrypsin, Trypsin+LysC, LysN, ArgC proteases suitable for different mass spec machines.| Try ESI |
 |
|---|
| ChTry ESI |
|
|---|
| ArgC ESI |
|
|---|
| LysN ESI |
|
|---|
| TryLysC ESI |
|
|---|
| Try MALDI |
|
|---|
| ChTry MALDI |
|
|---|
| ArgC MALDI |
|
|---|
| LysN MALDI |
|
|---|
| TryLysC MALDI |
|
|---|
| Try LTQ |
|
|---|
| ChTry LTQ |
|
|---|
| ArgC LTQ |
|
|---|
| LysN LTQ |
|
|---|
| TryLysC LTQ |
|
|---|
| Try MSlow |
|
|---|
| ChTry MSlow |
|
|---|
| ArgC MSlow |
|
|---|
| LysN MSlow |
|
|---|
| TryLysC MSlow |
|
|---|
| Try MShigh |
|
|---|
| ChTry MShigh |
|
|---|
| ArgC MShigh |
|
|---|
| LysN MShigh |
|
|---|
| TryLysC MShigh |
|
|---|
General Statistics
Number of major isoforms |
Number of additional isoforms |
Number of all proteins |
Number of amino acids |
Min. Seq. Length |
Max. Seq. Length |
Avg. Seq. Length |
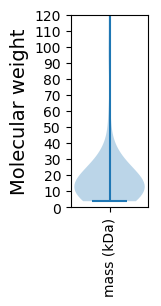
Avg. Mol. Weight |
|---|---|---|---|---|---|---|---|
0 |
15598 |
33 |
1331 |
179.3 |
20.3 |
Amino acid frequency
Ala |
Cys |
Asp |
Glu |
Phe |
Gly |
His |
Ile |
Lys |
Leu |
|---|---|---|---|---|---|---|---|---|---|
7.437 ± 0.409 | 0.654 ± 0.087 |
6.084 ± 0.214 | 8.719 ± 0.431 |
4.071 ± 0.202 | 6.18 ± 0.427 |
1.513 ± 0.133 | 6.257 ± 0.239 |
7.911 ± 0.3 | 8.463 ± 0.334 |
Met |
Asn |
Gln |
Pro |
Arg |
Ser |
Thr |
Val |
Trp |
Tyr |
|---|---|---|---|---|---|---|---|---|---|
2.629 ± 0.195 | 5.225 ± 0.26 |
2.949 ± 0.228 | 3.558 ± 0.285 |
4.257 ± 0.18 | 6.02 ± 0.208 |
6.065 ± 0.367 | 6.578 ± 0.237 |
1.225 ± 0.11 | 4.206 ± 0.259 |
Most of the basic statistics you can see at this page can be downloaded from this CSV file
See this proteome in:

Proteome-pI is available under Creative Commons Attribution-NoDerivs license, for more details see here
| Reference: Kozlowski LP. Proteome-pI 2.0: Proteome Isoelectric Point Database Update. Nucleic Acids Res. 2021, doi: 10.1093/nar/gkab944 | Contact: Lukasz P. Kozlowski |