Babesia bovis
Taxonomy: cellular organisms; Eukaryota; Sar; Alveolata; Apicomplexa; Aconoidasida; Piroplasmida; Babesiidae; Babesia
Average proteome isoelectric point is 6.55
Get precalculated fractions of proteins
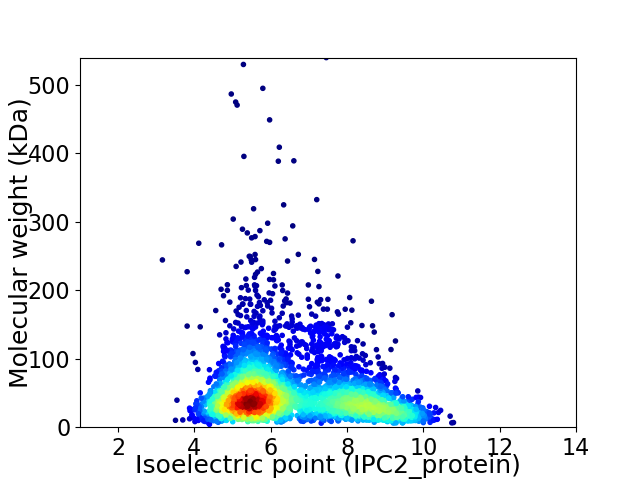
Virtual 2D-PAGE plot for 3690 proteins (isoelectric point calculated using IPC2_protein)
Get csv file with sequences according to given criteria:
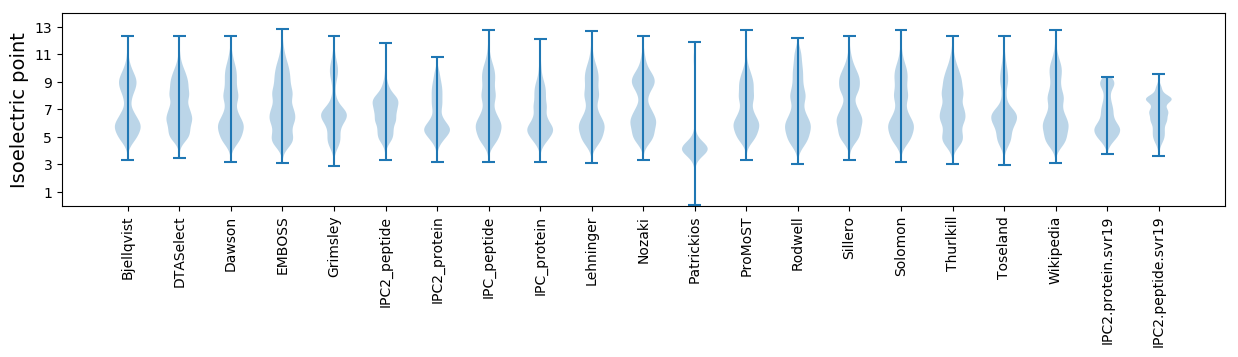
* You can choose from 21 different methods for calculating isoelectric point
Summary statistics related to proteome-wise predictions
Protein with the lowest isoelectric point:
>tr|A7ATC9|A7ATC9_BABBO Prolyl endopeptidase OS=Babesia bovis OX=5865 GN=BBOV_II002340 PE=3 SV=1
MM1 pKa = 7.67AAPSEE6 pKa = 4.06CDD8 pKa = 3.37YY9 pKa = 11.38TSSEE13 pKa = 4.12DD14 pKa = 3.64SASDD18 pKa = 3.53VCSSSSCSCDD28 pKa = 3.14SGSCCSSEE36 pKa = 4.49SADD39 pKa = 3.56EE40 pKa = 4.9CSSCSCSPRR49 pKa = 11.84SAGSNDD55 pKa = 2.76EE56 pKa = 5.07HH57 pKa = 7.79YY58 pKa = 10.93QDD60 pKa = 6.25DD61 pKa = 4.55LDD63 pKa = 3.88QLKK66 pKa = 8.36TFIADD71 pKa = 3.32VASLIRR77 pKa = 11.84QSRR80 pKa = 11.84NTEE83 pKa = 4.03DD84 pKa = 3.73VPVTTNVEE92 pKa = 4.22VQVSDD97 pKa = 3.78EE98 pKa = 4.52KK99 pKa = 11.08PIEE102 pKa = 4.35TPVEE106 pKa = 4.06QPVAAPFNKK115 pKa = 10.47DD116 pKa = 3.14LDD118 pKa = 3.89NEE120 pKa = 4.28IANFEE125 pKa = 3.98QLINSTEE132 pKa = 3.79IKK134 pKa = 10.8LNGHH138 pKa = 5.89SGFCEE143 pKa = 4.58FEE145 pKa = 4.24AQEE148 pKa = 4.24SPYY151 pKa = 9.79ATTVADD157 pKa = 4.12TPVGYY162 pKa = 10.6CFTNDD167 pKa = 2.9DD168 pKa = 3.87TARR171 pKa = 11.84EE172 pKa = 4.0EE173 pKa = 4.16MPEE176 pKa = 4.08EE177 pKa = 4.34SCSEE181 pKa = 4.23SEE183 pKa = 5.7DD184 pKa = 3.7EE185 pKa = 6.04AEE187 pKa = 4.43PDD189 pKa = 3.5LDD191 pKa = 3.9KK192 pKa = 11.48LHH194 pKa = 6.61SRR196 pKa = 11.84LVALDD201 pKa = 3.17LHH203 pKa = 8.65SYY205 pKa = 8.51MGLVEE210 pKa = 4.54SVLDD214 pKa = 3.75KK215 pKa = 10.76RR216 pKa = 11.84VKK218 pKa = 10.7LDD220 pKa = 3.58LLL222 pKa = 4.12
MM1 pKa = 7.67AAPSEE6 pKa = 4.06CDD8 pKa = 3.37YY9 pKa = 11.38TSSEE13 pKa = 4.12DD14 pKa = 3.64SASDD18 pKa = 3.53VCSSSSCSCDD28 pKa = 3.14SGSCCSSEE36 pKa = 4.49SADD39 pKa = 3.56EE40 pKa = 4.9CSSCSCSPRR49 pKa = 11.84SAGSNDD55 pKa = 2.76EE56 pKa = 5.07HH57 pKa = 7.79YY58 pKa = 10.93QDD60 pKa = 6.25DD61 pKa = 4.55LDD63 pKa = 3.88QLKK66 pKa = 8.36TFIADD71 pKa = 3.32VASLIRR77 pKa = 11.84QSRR80 pKa = 11.84NTEE83 pKa = 4.03DD84 pKa = 3.73VPVTTNVEE92 pKa = 4.22VQVSDD97 pKa = 3.78EE98 pKa = 4.52KK99 pKa = 11.08PIEE102 pKa = 4.35TPVEE106 pKa = 4.06QPVAAPFNKK115 pKa = 10.47DD116 pKa = 3.14LDD118 pKa = 3.89NEE120 pKa = 4.28IANFEE125 pKa = 3.98QLINSTEE132 pKa = 3.79IKK134 pKa = 10.8LNGHH138 pKa = 5.89SGFCEE143 pKa = 4.58FEE145 pKa = 4.24AQEE148 pKa = 4.24SPYY151 pKa = 9.79ATTVADD157 pKa = 4.12TPVGYY162 pKa = 10.6CFTNDD167 pKa = 2.9DD168 pKa = 3.87TARR171 pKa = 11.84EE172 pKa = 4.0EE173 pKa = 4.16MPEE176 pKa = 4.08EE177 pKa = 4.34SCSEE181 pKa = 4.23SEE183 pKa = 5.7DD184 pKa = 3.7EE185 pKa = 6.04AEE187 pKa = 4.43PDD189 pKa = 3.5LDD191 pKa = 3.9KK192 pKa = 11.48LHH194 pKa = 6.61SRR196 pKa = 11.84LVALDD201 pKa = 3.17LHH203 pKa = 8.65SYY205 pKa = 8.51MGLVEE210 pKa = 4.54SVLDD214 pKa = 3.75KK215 pKa = 10.76RR216 pKa = 11.84VKK218 pKa = 10.7LDD220 pKa = 3.58LLL222 pKa = 4.12
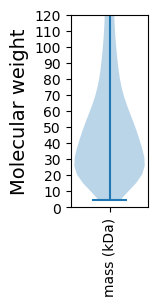
Molecular weight: 24.14 kDa
Isoelectric point according different methods:
Protein with the highest isoelectric point:
>tr|A7AX42|A7AX42_BABBO Uncharacterized protein OS=Babesia bovis OX=5865 GN=BBOV_I000210 PE=4 SV=1
MM1 pKa = 8.07RR2 pKa = 11.84SLAWLLFACLIGVATPFQAGNGRR25 pKa = 11.84QGAGNAPMLARR36 pKa = 11.84RR37 pKa = 11.84DD38 pKa = 3.76QALQAYY44 pKa = 8.28RR45 pKa = 11.84RR46 pKa = 11.84KK47 pKa = 10.49NNSIFNRR54 pKa = 11.84ITEE57 pKa = 4.47SVNSIAEE64 pKa = 4.59SINQTVPGGIATAVTVPIVTVAAAVTIRR92 pKa = 11.84SLLAPAKK99 pKa = 9.73PKK101 pKa = 10.46AAAPALNRR109 pKa = 11.84YY110 pKa = 8.16QCTGCGFTIFPAKK123 pKa = 10.18NRR125 pKa = 11.84EE126 pKa = 3.68EE127 pKa = 4.49RR128 pKa = 11.84FFSSSFTCPNCGAAKK143 pKa = 9.75NKK145 pKa = 9.67FVEE148 pKa = 4.57RR149 pKa = 11.84HH150 pKa = 4.4
MM1 pKa = 8.07RR2 pKa = 11.84SLAWLLFACLIGVATPFQAGNGRR25 pKa = 11.84QGAGNAPMLARR36 pKa = 11.84RR37 pKa = 11.84DD38 pKa = 3.76QALQAYY44 pKa = 8.28RR45 pKa = 11.84RR46 pKa = 11.84KK47 pKa = 10.49NNSIFNRR54 pKa = 11.84ITEE57 pKa = 4.47SVNSIAEE64 pKa = 4.59SINQTVPGGIATAVTVPIVTVAAAVTIRR92 pKa = 11.84SLLAPAKK99 pKa = 9.73PKK101 pKa = 10.46AAAPALNRR109 pKa = 11.84YY110 pKa = 8.16QCTGCGFTIFPAKK123 pKa = 10.18NRR125 pKa = 11.84EE126 pKa = 3.68EE127 pKa = 4.49RR128 pKa = 11.84FFSSSFTCPNCGAAKK143 pKa = 9.75NKK145 pKa = 9.67FVEE148 pKa = 4.57RR149 pKa = 11.84HH150 pKa = 4.4
Molecular weight: 16.07 kDa
Isoelectric point according different methods:
Peptides (in silico digests for buttom-up proteomics)
Below you can find in silico digests of the whole proteome with Trypsin, Chymotrypsin, Trypsin+LysC, LysN, ArgC proteases suitable for different mass spec machines.| Try ESI |
 |
|---|
| ChTry ESI |
|
|---|
| ArgC ESI |
|
|---|
| LysN ESI |
|
|---|
| TryLysC ESI |
|
|---|
| Try MALDI |
|
|---|
| ChTry MALDI |
|
|---|
| ArgC MALDI |
|
|---|
| LysN MALDI |
|
|---|
| TryLysC MALDI |
|
|---|
| Try LTQ |
|
|---|
| ChTry LTQ |
|
|---|
| ArgC LTQ |
|
|---|
| LysN LTQ |
|
|---|
| TryLysC LTQ |
|
|---|
| Try MSlow |
|
|---|
| ChTry MSlow |
|
|---|
| ArgC MSlow |
|
|---|
| LysN MSlow |
|
|---|
| TryLysC MSlow |
|
|---|
| Try MShigh |
|
|---|
| ChTry MShigh |
|
|---|
| ArgC MShigh |
|
|---|
| LysN MShigh |
|
|---|
| TryLysC MShigh |
|
|---|
General Statistics
Number of major isoforms |
Number of additional isoforms |
Number of all proteins |
Number of amino acids |
Min. Seq. Length |
Max. Seq. Length |
Avg. Seq. Length |
Avg. Mol. Weight |
|---|---|---|---|---|---|---|---|
0 |
1851840 |
38 |
4820 |
501.9 |
56.48 |
Amino acid frequency
Ala |
Cys |
Asp |
Glu |
Phe |
Gly |
His |
Ile |
Lys |
Leu |
|---|---|---|---|---|---|---|---|---|---|
6.137 ± 0.032 | 2.234 ± 0.024 |
6.105 ± 0.027 | 6.08 ± 0.044 |
3.758 ± 0.024 | 5.786 ± 0.042 |
2.6 ± 0.015 | 6.082 ± 0.031 |
6.022 ± 0.041 | 9.464 ± 0.037 |
Met |
Asn |
Gln |
Pro |
Arg |
Ser |
Thr |
Val |
Trp |
Tyr |
|---|---|---|---|---|---|---|---|---|---|
2.614 ± 0.017 | 4.841 ± 0.03 |
4.303 ± 0.026 | 3.5 ± 0.021 |
5.388 ± 0.033 | 8.087 ± 0.043 |
5.691 ± 0.027 | 6.642 ± 0.025 |
1.043 ± 0.012 | 3.621 ± 0.019 |
Most of the basic statistics you can see at this page can be downloaded from this CSV file
See this proteome in:

Proteome-pI is available under Creative Commons Attribution-NoDerivs license, for more details see here
| Reference: Kozlowski LP. Proteome-pI 2.0: Proteome Isoelectric Point Database Update. Nucleic Acids Res. 2021, doi: 10.1093/nar/gkab944 | Contact: Lukasz P. Kozlowski |