Blautia sp. CAG:52
Taxonomy: cellular organisms; Bacteria; Terrabacteria group; Firmicutes; Clostridia; Eubacteriales; Lachnospiraceae; Blautia; environmental samples
Average proteome isoelectric point is 6.05
Get precalculated fractions of proteins
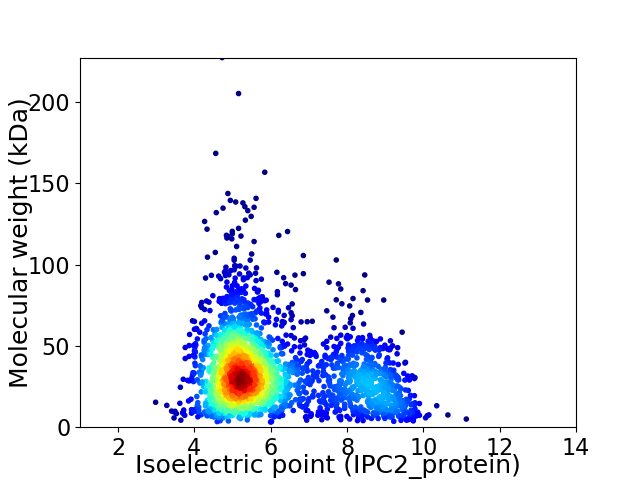
Virtual 2D-PAGE plot for 2465 proteins (isoelectric point calculated using IPC2_protein)
Get csv file with sequences according to given criteria:
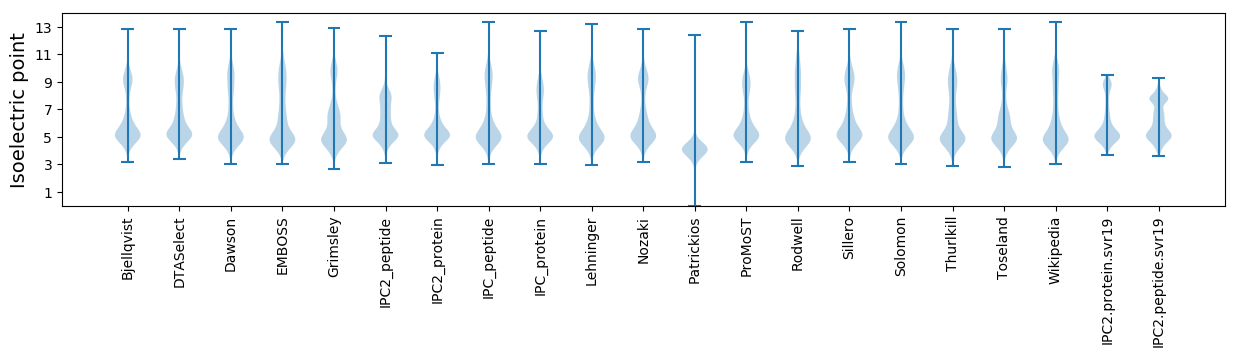
* You can choose from 21 different methods for calculating isoelectric point
Summary statistics related to proteome-wise predictions
Protein with the lowest isoelectric point:
>tr|R6G8M4|R6G8M4_9FIRM Uncharacterized protein OS=Blautia sp. CAG:52 OX=1262758 GN=BN690_00824 PE=4 SV=1
MM1 pKa = 7.29KK2 pKa = 9.78KK3 pKa = 10.03KK4 pKa = 9.68WMASTALACSCMLLISGCSGNKK26 pKa = 9.71ADD28 pKa = 5.92DD29 pKa = 3.98FDD31 pKa = 4.89AVAYY35 pKa = 5.98TTAYY39 pKa = 9.51LDD41 pKa = 3.33GMIRR45 pKa = 11.84GNVDD49 pKa = 3.33TLSSLSGVSSDD60 pKa = 5.38DD61 pKa = 3.2LTATFNSMIDD71 pKa = 3.78DD72 pKa = 4.53LVSSSIGGDD81 pKa = 3.29GSSPGSTQISPQLRR95 pKa = 11.84QDD97 pKa = 3.4YY98 pKa = 10.65TDD100 pKa = 3.55FWKK103 pKa = 10.7QAFSNTKK110 pKa = 9.92YY111 pKa = 10.38DD112 pKa = 3.49VKK114 pKa = 10.98KK115 pKa = 10.73ADD117 pKa = 3.79KK118 pKa = 10.89KK119 pKa = 10.43EE120 pKa = 3.68NTYY123 pKa = 10.81QITVDD128 pKa = 3.63TQQMQLYY135 pKa = 7.99TAMEE139 pKa = 5.12PIYY142 pKa = 10.26DD143 pKa = 4.11EE144 pKa = 5.26KK145 pKa = 11.22LADD148 pKa = 3.76YY149 pKa = 11.0LKK151 pKa = 10.98DD152 pKa = 3.51NSVDD156 pKa = 3.24SDD158 pKa = 3.72QYY160 pKa = 11.38IEE162 pKa = 4.83DD163 pKa = 4.15VYY165 pKa = 11.83SLMLEE170 pKa = 4.83AYY172 pKa = 7.75QTALDD177 pKa = 3.64KK178 pKa = 11.58AEE180 pKa = 4.21YY181 pKa = 9.93NDD183 pKa = 4.25PEE185 pKa = 4.73SVTVTLQKK193 pKa = 10.79DD194 pKa = 3.91DD195 pKa = 4.06SEE197 pKa = 4.31QWSISSDD204 pKa = 4.06DD205 pKa = 3.42MTTLKK210 pKa = 10.77NALIDD215 pKa = 3.97LASLNPSADD224 pKa = 3.36GTTGTPAQVTAEE236 pKa = 4.96DD237 pKa = 3.71IANSQSEE244 pKa = 4.32GAPNMEE250 pKa = 4.07YY251 pKa = 10.15PKK253 pKa = 10.68DD254 pKa = 3.93LEE256 pKa = 4.14STPAYY261 pKa = 9.69KK262 pKa = 10.66VGDD265 pKa = 4.73AITIQSDD272 pKa = 3.69GKK274 pKa = 10.58DD275 pKa = 3.28VATFTIDD282 pKa = 3.18KK283 pKa = 11.21VEE285 pKa = 4.18VTDD288 pKa = 5.81DD289 pKa = 3.26RR290 pKa = 11.84SEE292 pKa = 4.4YY293 pKa = 9.84DD294 pKa = 2.97TSNPDD299 pKa = 3.01KK300 pKa = 11.07VIVITYY306 pKa = 7.23TYY308 pKa = 10.76KK309 pKa = 10.86NLAFDD314 pKa = 5.53DD315 pKa = 4.48PLLYY319 pKa = 10.74DD320 pKa = 3.24QMSFRR325 pKa = 11.84VLDD328 pKa = 3.94GDD330 pKa = 4.56TVCLPYY336 pKa = 10.9YY337 pKa = 10.44LADD340 pKa = 3.69LTSPDD345 pKa = 3.85LATTGGDD352 pKa = 3.23AVTATAAYY360 pKa = 9.22GISASCNEE368 pKa = 3.47VTIYY372 pKa = 11.17VDD374 pKa = 4.01GAQIAFPFQVSASVSS389 pKa = 3.32
MM1 pKa = 7.29KK2 pKa = 9.78KK3 pKa = 10.03KK4 pKa = 9.68WMASTALACSCMLLISGCSGNKK26 pKa = 9.71ADD28 pKa = 5.92DD29 pKa = 3.98FDD31 pKa = 4.89AVAYY35 pKa = 5.98TTAYY39 pKa = 9.51LDD41 pKa = 3.33GMIRR45 pKa = 11.84GNVDD49 pKa = 3.33TLSSLSGVSSDD60 pKa = 5.38DD61 pKa = 3.2LTATFNSMIDD71 pKa = 3.78DD72 pKa = 4.53LVSSSIGGDD81 pKa = 3.29GSSPGSTQISPQLRR95 pKa = 11.84QDD97 pKa = 3.4YY98 pKa = 10.65TDD100 pKa = 3.55FWKK103 pKa = 10.7QAFSNTKK110 pKa = 9.92YY111 pKa = 10.38DD112 pKa = 3.49VKK114 pKa = 10.98KK115 pKa = 10.73ADD117 pKa = 3.79KK118 pKa = 10.89KK119 pKa = 10.43EE120 pKa = 3.68NTYY123 pKa = 10.81QITVDD128 pKa = 3.63TQQMQLYY135 pKa = 7.99TAMEE139 pKa = 5.12PIYY142 pKa = 10.26DD143 pKa = 4.11EE144 pKa = 5.26KK145 pKa = 11.22LADD148 pKa = 3.76YY149 pKa = 11.0LKK151 pKa = 10.98DD152 pKa = 3.51NSVDD156 pKa = 3.24SDD158 pKa = 3.72QYY160 pKa = 11.38IEE162 pKa = 4.83DD163 pKa = 4.15VYY165 pKa = 11.83SLMLEE170 pKa = 4.83AYY172 pKa = 7.75QTALDD177 pKa = 3.64KK178 pKa = 11.58AEE180 pKa = 4.21YY181 pKa = 9.93NDD183 pKa = 4.25PEE185 pKa = 4.73SVTVTLQKK193 pKa = 10.79DD194 pKa = 3.91DD195 pKa = 4.06SEE197 pKa = 4.31QWSISSDD204 pKa = 4.06DD205 pKa = 3.42MTTLKK210 pKa = 10.77NALIDD215 pKa = 3.97LASLNPSADD224 pKa = 3.36GTTGTPAQVTAEE236 pKa = 4.96DD237 pKa = 3.71IANSQSEE244 pKa = 4.32GAPNMEE250 pKa = 4.07YY251 pKa = 10.15PKK253 pKa = 10.68DD254 pKa = 3.93LEE256 pKa = 4.14STPAYY261 pKa = 9.69KK262 pKa = 10.66VGDD265 pKa = 4.73AITIQSDD272 pKa = 3.69GKK274 pKa = 10.58DD275 pKa = 3.28VATFTIDD282 pKa = 3.18KK283 pKa = 11.21VEE285 pKa = 4.18VTDD288 pKa = 5.81DD289 pKa = 3.26RR290 pKa = 11.84SEE292 pKa = 4.4YY293 pKa = 9.84DD294 pKa = 2.97TSNPDD299 pKa = 3.01KK300 pKa = 11.07VIVITYY306 pKa = 7.23TYY308 pKa = 10.76KK309 pKa = 10.86NLAFDD314 pKa = 5.53DD315 pKa = 4.48PLLYY319 pKa = 10.74DD320 pKa = 3.24QMSFRR325 pKa = 11.84VLDD328 pKa = 3.94GDD330 pKa = 4.56TVCLPYY336 pKa = 10.9YY337 pKa = 10.44LADD340 pKa = 3.69LTSPDD345 pKa = 3.85LATTGGDD352 pKa = 3.23AVTATAAYY360 pKa = 9.22GISASCNEE368 pKa = 3.47VTIYY372 pKa = 11.17VDD374 pKa = 4.01GAQIAFPFQVSASVSS389 pKa = 3.32
Molecular weight: 42.26 kDa
Isoelectric point according different methods:
Protein with the highest isoelectric point:
>tr|R6G8F1|R6G8F1_9FIRM HTH lysR-type domain-containing protein OS=Blautia sp. CAG:52 OX=1262758 GN=BN690_00792 PE=3 SV=1
MM1 pKa = 7.67KK2 pKa = 8.72MTFQPKK8 pKa = 8.86KK9 pKa = 8.2RR10 pKa = 11.84SRR12 pKa = 11.84AKK14 pKa = 9.27VHH16 pKa = 5.81GFRR19 pKa = 11.84ARR21 pKa = 11.84MSTKK25 pKa = 10.15GGRR28 pKa = 11.84KK29 pKa = 8.69VLAARR34 pKa = 11.84RR35 pKa = 11.84LKK37 pKa = 10.56GRR39 pKa = 11.84KK40 pKa = 8.92SLSAA44 pKa = 3.86
MM1 pKa = 7.67KK2 pKa = 8.72MTFQPKK8 pKa = 8.86KK9 pKa = 8.2RR10 pKa = 11.84SRR12 pKa = 11.84AKK14 pKa = 9.27VHH16 pKa = 5.81GFRR19 pKa = 11.84ARR21 pKa = 11.84MSTKK25 pKa = 10.15GGRR28 pKa = 11.84KK29 pKa = 8.69VLAARR34 pKa = 11.84RR35 pKa = 11.84LKK37 pKa = 10.56GRR39 pKa = 11.84KK40 pKa = 8.92SLSAA44 pKa = 3.86
Molecular weight: 5.02 kDa
Isoelectric point according different methods:
Peptides (in silico digests for buttom-up proteomics)
Below you can find in silico digests of the whole proteome with Trypsin, Chymotrypsin, Trypsin+LysC, LysN, ArgC proteases suitable for different mass spec machines.| Try ESI |
 |
|---|
| ChTry ESI |
|
|---|
| ArgC ESI |
|
|---|
| LysN ESI |
|
|---|
| TryLysC ESI |
|
|---|
| Try MALDI |
|
|---|
| ChTry MALDI |
|
|---|
| ArgC MALDI |
|
|---|
| LysN MALDI |
|
|---|
| TryLysC MALDI |
|
|---|
| Try LTQ |
|
|---|
| ChTry LTQ |
|
|---|
| ArgC LTQ |
|
|---|
| LysN LTQ |
|
|---|
| TryLysC LTQ |
|
|---|
| Try MSlow |
|
|---|
| ChTry MSlow |
|
|---|
| ArgC MSlow |
|
|---|
| LysN MSlow |
|
|---|
| TryLysC MSlow |
|
|---|
| Try MShigh |
|
|---|
| ChTry MShigh |
|
|---|
| ArgC MShigh |
|
|---|
| LysN MShigh |
|
|---|
| TryLysC MShigh |
|
|---|
General Statistics
Number of major isoforms |
Number of additional isoforms |
Number of all proteins |
Number of amino acids |
Min. Seq. Length |
Max. Seq. Length |
Avg. Seq. Length |
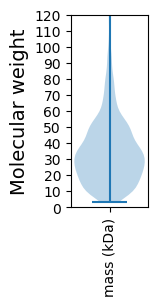
Avg. Mol. Weight |
|---|---|---|---|---|---|---|---|
0 |
785732 |
29 |
2004 |
318.8 |
35.8 |
Amino acid frequency
Ala |
Cys |
Asp |
Glu |
Phe |
Gly |
His |
Ile |
Lys |
Leu |
|---|---|---|---|---|---|---|---|---|---|
7.318 ± 0.048 | 1.556 ± 0.019 |
5.498 ± 0.04 | 7.89 ± 0.059 |
3.911 ± 0.037 | 7.355 ± 0.044 |
1.829 ± 0.02 | 7.044 ± 0.047 |
6.761 ± 0.045 | 8.879 ± 0.058 |
Met |
Asn |
Gln |
Pro |
Arg |
Ser |
Thr |
Val |
Trp |
Tyr |
|---|---|---|---|---|---|---|---|---|---|
3.227 ± 0.027 | 3.999 ± 0.029 |
3.406 ± 0.026 | 3.642 ± 0.036 |
4.425 ± 0.038 | 5.421 ± 0.037 |
5.577 ± 0.039 | 7.05 ± 0.041 |
1.057 ± 0.021 | 4.156 ± 0.039 |
Most of the basic statistics you can see at this page can be downloaded from this CSV file
See this proteome in:

Proteome-pI is available under Creative Commons Attribution-NoDerivs license, for more details see here
| Reference: Kozlowski LP. Proteome-pI 2.0: Proteome Isoelectric Point Database Update. Nucleic Acids Res. 2021, doi: 10.1093/nar/gkab944 | Contact: Lukasz P. Kozlowski |