Cyanophage S-TIM5
Taxonomy: Viruses; Duplodnaviria; Heunggongvirae; Uroviricota; Caudoviricetes; Caudovirales; Myoviridae; Aurunvirus; Synechococcus virus STIM5
Average proteome isoelectric point is 5.8
Get precalculated fractions of proteins
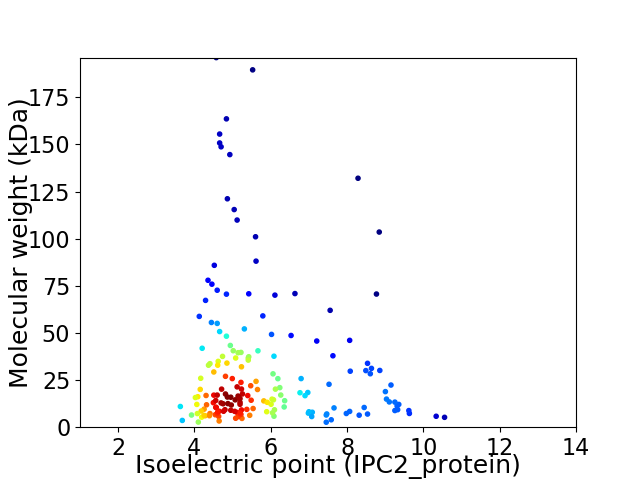
Virtual 2D-PAGE plot for 180 proteins (isoelectric point calculated using IPC2_protein)
Get csv file with sequences according to given criteria:
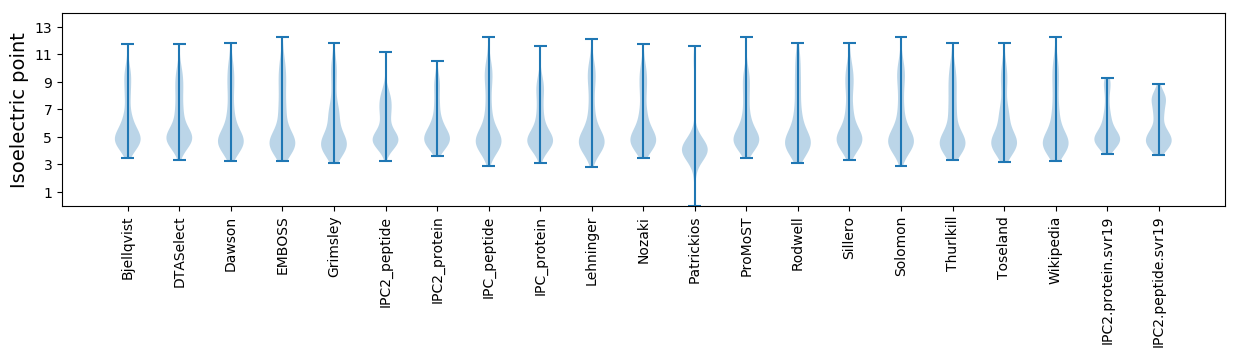
* You can choose from 21 different methods for calculating isoelectric point
Summary statistics related to proteome-wise predictions
Protein with the lowest isoelectric point:
>tr|H6WG04|H6WG04_9CAUD Uncharacterized protein OS=Cyanophage S-TIM5 OX=1137745 PE=4 SV=1
MM1 pKa = 8.02LEE3 pKa = 4.55LLLNLNMTCQQADD16 pKa = 3.57ALILKK21 pKa = 9.15INKK24 pKa = 9.31YY25 pKa = 10.2FDD27 pKa = 3.54LSADD31 pKa = 3.34VRR33 pKa = 11.84LEE35 pKa = 3.96LVDD38 pKa = 3.65TVKK41 pKa = 10.89DD42 pKa = 3.74YY43 pKa = 11.2TPEE46 pKa = 4.22CEE48 pKa = 4.98FYY50 pKa = 10.67WDD52 pKa = 4.37ANDD55 pKa = 3.39
MM1 pKa = 8.02LEE3 pKa = 4.55LLLNLNMTCQQADD16 pKa = 3.57ALILKK21 pKa = 9.15INKK24 pKa = 9.31YY25 pKa = 10.2FDD27 pKa = 3.54LSADD31 pKa = 3.34VRR33 pKa = 11.84LEE35 pKa = 3.96LVDD38 pKa = 3.65TVKK41 pKa = 10.89DD42 pKa = 3.74YY43 pKa = 11.2TPEE46 pKa = 4.22CEE48 pKa = 4.98FYY50 pKa = 10.67WDD52 pKa = 4.37ANDD55 pKa = 3.39
Molecular weight: 6.46 kDa
Isoelectric point according different methods:
Protein with the highest isoelectric point:
>tr|H6WG35|H6WG35_9CAUD Uncharacterized protein OS=Cyanophage S-TIM5 OX=1137745 PE=4 SV=1
MM1 pKa = 7.11TGVYY5 pKa = 8.76STGTLRR11 pKa = 11.84LSAVTGPPWASSQKK25 pKa = 10.49KK26 pKa = 8.57VGKK29 pKa = 9.63GVKK32 pKa = 8.79TGTGVYY38 pKa = 7.67FTGSLRR44 pKa = 11.84QRR46 pKa = 11.84KK47 pKa = 6.44WEE49 pKa = 4.01RR50 pKa = 11.84GINTT54 pKa = 3.78
MM1 pKa = 7.11TGVYY5 pKa = 8.76STGTLRR11 pKa = 11.84LSAVTGPPWASSQKK25 pKa = 10.49KK26 pKa = 8.57VGKK29 pKa = 9.63GVKK32 pKa = 8.79TGTGVYY38 pKa = 7.67FTGSLRR44 pKa = 11.84QRR46 pKa = 11.84KK47 pKa = 6.44WEE49 pKa = 4.01RR50 pKa = 11.84GINTT54 pKa = 3.78
Molecular weight: 5.8 kDa
Isoelectric point according different methods:
Peptides (in silico digests for buttom-up proteomics)
Below you can find in silico digests of the whole proteome with Trypsin, Chymotrypsin, Trypsin+LysC, LysN, ArgC proteases suitable for different mass spec machines.| Try ESI |
 |
|---|
| ChTry ESI |
|
|---|
| ArgC ESI |
|
|---|
| LysN ESI |
|
|---|
| TryLysC ESI |
|
|---|
| Try MALDI |
|
|---|
| ChTry MALDI |
|
|---|
| ArgC MALDI |
|
|---|
| LysN MALDI |
|
|---|
| TryLysC MALDI |
|
|---|
| Try LTQ |
|
|---|
| ChTry LTQ |
|
|---|
| ArgC LTQ |
|
|---|
| LysN LTQ |
|
|---|
| TryLysC LTQ |
|
|---|
| Try MSlow |
|
|---|
| ChTry MSlow |
|
|---|
| ArgC MSlow |
|
|---|
| LysN MSlow |
|
|---|
| TryLysC MSlow |
|
|---|
| Try MShigh |
|
|---|
| ChTry MShigh |
|
|---|
| ArgC MShigh |
|
|---|
| LysN MShigh |
|
|---|
| TryLysC MShigh |
|
|---|
General Statistics
Number of major isoforms |
Number of additional isoforms |
Number of all proteins |
Number of amino acids |
Min. Seq. Length |
Max. Seq. Length |
Avg. Seq. Length |
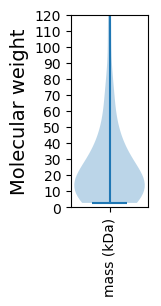
Avg. Mol. Weight |
|---|---|---|---|---|---|---|---|
51181 |
23 |
1830 |
284.3 |
31.44 |
Amino acid frequency
Ala |
Cys |
Asp |
Glu |
Phe |
Gly |
His |
Ile |
Lys |
Leu |
|---|---|---|---|---|---|---|---|---|---|
7.038 ± 0.195 | 0.852 ± 0.068 |
6.125 ± 0.13 | 6.487 ± 0.322 |
4.213 ± 0.126 | 8.204 ± 0.315 |
1.389 ± 0.091 | 6.291 ± 0.145 |
5.932 ± 0.34 | 7.755 ± 0.215 |
Met |
Asn |
Gln |
Pro |
Arg |
Ser |
Thr |
Val |
Trp |
Tyr |
|---|---|---|---|---|---|---|---|---|---|
1.741 ± 0.137 | 6.016 ± 0.259 |
4.058 ± 0.161 | 3.484 ± 0.094 |
4.271 ± 0.144 | 7.876 ± 0.167 |
6.96 ± 0.325 | 6.16 ± 0.137 |
1.27 ± 0.085 | 3.878 ± 0.138 |
Most of the basic statistics you can see at this page can be downloaded from this CSV file
See this proteome in:

Proteome-pI is available under Creative Commons Attribution-NoDerivs license, for more details see here
| Reference: Kozlowski LP. Proteome-pI 2.0: Proteome Isoelectric Point Database Update. Nucleic Acids Res. 2021, doi: 10.1093/nar/gkab944 | Contact: Lukasz P. Kozlowski |