Capybara microvirus Cap3_SP_468
Taxonomy: Viruses; Monodnaviria; Sangervirae; Phixviricota; Malgrandaviricetes; Petitvirales; Microviridae; unclassified Microviridae
Average proteome isoelectric point is 6.25
Get precalculated fractions of proteins
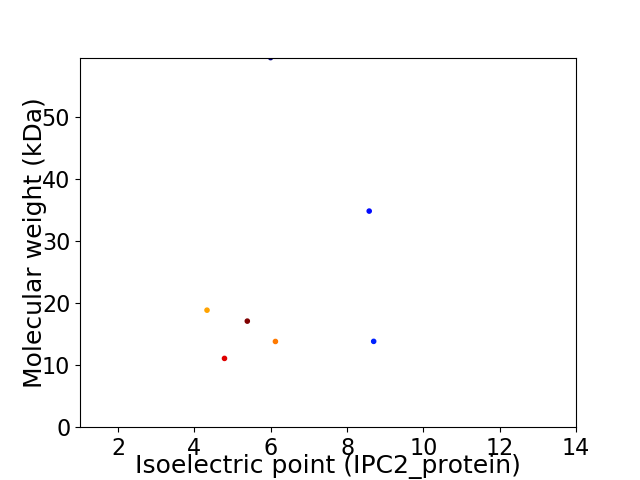
Virtual 2D-PAGE plot for 7 proteins (isoelectric point calculated using IPC2_protein)
Get csv file with sequences according to given criteria:
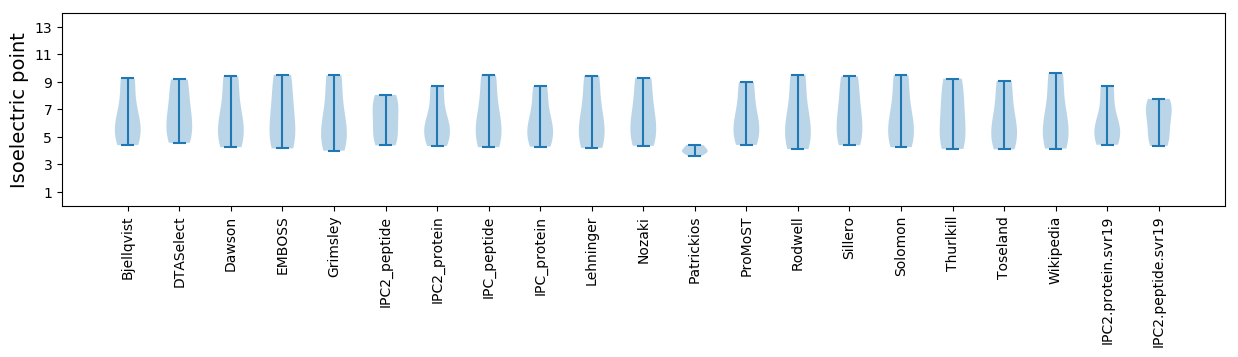
* You can choose from 21 different methods for calculating isoelectric point
Summary statistics related to proteome-wise predictions
Protein with the lowest isoelectric point:
>tr|A0A4P8W8P5|A0A4P8W8P5_9VIRU Major capsid protein OS=Capybara microvirus Cap3_SP_468 OX=2585463 PE=3 SV=1
MM1 pKa = 7.43NKK3 pKa = 9.74LFKK6 pKa = 9.96PDD8 pKa = 3.47EE9 pKa = 4.45VGSYY13 pKa = 9.24PVNVQSDD20 pKa = 3.41FDD22 pKa = 3.37QYY24 pKa = 10.6YY25 pKa = 9.97FEE27 pKa = 4.95NEE29 pKa = 4.1VVKK32 pKa = 10.87KK33 pKa = 9.52FVKK36 pKa = 10.02TGVDD40 pKa = 3.38NEE42 pKa = 4.29GDD44 pKa = 3.53DD45 pKa = 3.65VGYY48 pKa = 9.94IQEE51 pKa = 4.18KK52 pKa = 9.99VIVHH56 pKa = 5.98KK57 pKa = 10.79RR58 pKa = 11.84LIKK61 pKa = 10.75DD62 pKa = 3.4VVAQDD67 pKa = 3.47ADD69 pKa = 4.06SVGVEE74 pKa = 4.6PYY76 pKa = 10.68LKK78 pKa = 10.23MMALSGQSLPDD89 pKa = 3.15VSFTDD94 pKa = 4.36EE95 pKa = 4.68INDD98 pKa = 3.42FTQFPEE104 pKa = 4.25DD105 pKa = 3.18VGDD108 pKa = 4.39AMRR111 pKa = 11.84LGDD114 pKa = 4.59KK115 pKa = 10.99ANALYY120 pKa = 10.69ASLPEE125 pKa = 4.3EE126 pKa = 3.57IRR128 pKa = 11.84RR129 pKa = 11.84NYY131 pKa = 10.02TLDD134 pKa = 2.88QFMQSDD140 pKa = 4.32YY141 pKa = 11.23EE142 pKa = 4.64KK143 pKa = 10.58IVSDD147 pKa = 3.55YY148 pKa = 11.32LALKK152 pKa = 9.63KK153 pKa = 10.78AEE155 pKa = 4.03IEE157 pKa = 3.99AAQKK161 pKa = 10.75GGSEE165 pKa = 4.26NVV167 pKa = 3.13
MM1 pKa = 7.43NKK3 pKa = 9.74LFKK6 pKa = 9.96PDD8 pKa = 3.47EE9 pKa = 4.45VGSYY13 pKa = 9.24PVNVQSDD20 pKa = 3.41FDD22 pKa = 3.37QYY24 pKa = 10.6YY25 pKa = 9.97FEE27 pKa = 4.95NEE29 pKa = 4.1VVKK32 pKa = 10.87KK33 pKa = 9.52FVKK36 pKa = 10.02TGVDD40 pKa = 3.38NEE42 pKa = 4.29GDD44 pKa = 3.53DD45 pKa = 3.65VGYY48 pKa = 9.94IQEE51 pKa = 4.18KK52 pKa = 9.99VIVHH56 pKa = 5.98KK57 pKa = 10.79RR58 pKa = 11.84LIKK61 pKa = 10.75DD62 pKa = 3.4VVAQDD67 pKa = 3.47ADD69 pKa = 4.06SVGVEE74 pKa = 4.6PYY76 pKa = 10.68LKK78 pKa = 10.23MMALSGQSLPDD89 pKa = 3.15VSFTDD94 pKa = 4.36EE95 pKa = 4.68INDD98 pKa = 3.42FTQFPEE104 pKa = 4.25DD105 pKa = 3.18VGDD108 pKa = 4.39AMRR111 pKa = 11.84LGDD114 pKa = 4.59KK115 pKa = 10.99ANALYY120 pKa = 10.69ASLPEE125 pKa = 4.3EE126 pKa = 3.57IRR128 pKa = 11.84RR129 pKa = 11.84NYY131 pKa = 10.02TLDD134 pKa = 2.88QFMQSDD140 pKa = 4.32YY141 pKa = 11.23EE142 pKa = 4.64KK143 pKa = 10.58IVSDD147 pKa = 3.55YY148 pKa = 11.32LALKK152 pKa = 9.63KK153 pKa = 10.78AEE155 pKa = 4.03IEE157 pKa = 3.99AAQKK161 pKa = 10.75GGSEE165 pKa = 4.26NVV167 pKa = 3.13
Molecular weight: 18.85 kDa
Isoelectric point according different methods:
Protein with the highest isoelectric point:
>tr|A0A4V1FVU0|A0A4V1FVU0_9VIRU Prophage CP4-57 regulatory protein OS=Capybara microvirus Cap3_SP_468 OX=2585463 PE=4 SV=1
MM1 pKa = 7.75TYY3 pKa = 7.39MTKK6 pKa = 9.89QQDD9 pKa = 3.4HH10 pKa = 6.79FIKK13 pKa = 10.03YY14 pKa = 10.33LKK16 pKa = 10.4YY17 pKa = 10.52SLVNVDD23 pKa = 4.09SLEE26 pKa = 4.23NDD28 pKa = 3.32DD29 pKa = 4.79FIYY32 pKa = 10.66RR33 pKa = 11.84IDD35 pKa = 3.58VVVRR39 pKa = 11.84KK40 pKa = 8.12TGISRR45 pKa = 11.84RR46 pKa = 11.84TIYY49 pKa = 10.31RR50 pKa = 11.84LCKK53 pKa = 10.11EE54 pKa = 4.08YY55 pKa = 10.94DD56 pKa = 3.26FPIYY60 pKa = 10.16RR61 pKa = 11.84GCFTVNLARR70 pKa = 11.84FWHH73 pKa = 5.57VFGTNKK79 pKa = 10.25RR80 pKa = 11.84STKK83 pKa = 10.16KK84 pKa = 9.99INLFNTEE91 pKa = 3.68YY92 pKa = 10.57RR93 pKa = 11.84IEE95 pKa = 4.03EE96 pKa = 4.34DD97 pKa = 2.89KK98 pKa = 11.71EE99 pKa = 3.86EE100 pKa = 4.26IYY102 pKa = 10.68RR103 pKa = 11.84IAHH106 pKa = 5.0VNWIGVHH113 pKa = 5.41
MM1 pKa = 7.75TYY3 pKa = 7.39MTKK6 pKa = 9.89QQDD9 pKa = 3.4HH10 pKa = 6.79FIKK13 pKa = 10.03YY14 pKa = 10.33LKK16 pKa = 10.4YY17 pKa = 10.52SLVNVDD23 pKa = 4.09SLEE26 pKa = 4.23NDD28 pKa = 3.32DD29 pKa = 4.79FIYY32 pKa = 10.66RR33 pKa = 11.84IDD35 pKa = 3.58VVVRR39 pKa = 11.84KK40 pKa = 8.12TGISRR45 pKa = 11.84RR46 pKa = 11.84TIYY49 pKa = 10.31RR50 pKa = 11.84LCKK53 pKa = 10.11EE54 pKa = 4.08YY55 pKa = 10.94DD56 pKa = 3.26FPIYY60 pKa = 10.16RR61 pKa = 11.84GCFTVNLARR70 pKa = 11.84FWHH73 pKa = 5.57VFGTNKK79 pKa = 10.25RR80 pKa = 11.84STKK83 pKa = 10.16KK84 pKa = 9.99INLFNTEE91 pKa = 3.68YY92 pKa = 10.57RR93 pKa = 11.84IEE95 pKa = 4.03EE96 pKa = 4.34DD97 pKa = 2.89KK98 pKa = 11.71EE99 pKa = 3.86EE100 pKa = 4.26IYY102 pKa = 10.68RR103 pKa = 11.84IAHH106 pKa = 5.0VNWIGVHH113 pKa = 5.41
Molecular weight: 13.83 kDa
Isoelectric point according different methods:
Peptides (in silico digests for buttom-up proteomics)
Below you can find in silico digests of the whole proteome with Trypsin, Chymotrypsin, Trypsin+LysC, LysN, ArgC proteases suitable for different mass spec machines.| Try ESI |
 |
|---|
| ChTry ESI |
|
|---|
| ArgC ESI |
|
|---|
| LysN ESI |
|
|---|
| TryLysC ESI |
|
|---|
| Try MALDI |
|
|---|
| ChTry MALDI |
|
|---|
| ArgC MALDI |
|
|---|
| LysN MALDI |
|
|---|
| TryLysC MALDI |
|
|---|
| Try LTQ |
|
|---|
| ChTry LTQ |
|
|---|
| ArgC LTQ |
|
|---|
| LysN LTQ |
|
|---|
| TryLysC LTQ |
|
|---|
| Try MSlow |
|
|---|
| ChTry MSlow |
|
|---|
| ArgC MSlow |
|
|---|
| LysN MSlow |
|
|---|
| TryLysC MSlow |
|
|---|
| Try MShigh |
|
|---|
| ChTry MShigh |
|
|---|
| ArgC MShigh |
|
|---|
| LysN MShigh |
|
|---|
| TryLysC MShigh |
|
|---|
General Statistics
Number of major isoforms |
Number of additional isoforms |
Number of all proteins |
Number of amino acids |
Min. Seq. Length |
Max. Seq. Length |
Avg. Seq. Length |
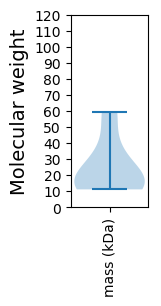
Avg. Mol. Weight |
|---|---|---|---|---|---|---|---|
0 |
1494 |
98 |
535 |
213.4 |
24.14 |
Amino acid frequency
Ala |
Cys |
Asp |
Glu |
Phe |
Gly |
His |
Ile |
Lys |
Leu |
|---|---|---|---|---|---|---|---|---|---|
5.89 ± 0.67 | 1.339 ± 0.682 |
6.426 ± 0.695 | 4.819 ± 0.519 |
5.154 ± 0.443 | 6.225 ± 0.624 |
2.008 ± 0.369 | 5.957 ± 0.638 |
7.296 ± 1.029 | 9.17 ± 0.944 |
Met |
Asn |
Gln |
Pro |
Arg |
Ser |
Thr |
Val |
Trp |
Tyr |
|---|---|---|---|---|---|---|---|---|---|
2.075 ± 0.268 | 5.288 ± 0.318 |
4.15 ± 0.786 | 4.351 ± 0.545 |
3.681 ± 0.764 | 8.099 ± 0.946 |
5.087 ± 0.74 | 6.627 ± 0.854 |
1.071 ± 0.216 | 5.288 ± 0.632 |
Most of the basic statistics you can see at this page can be downloaded from this CSV file
See this proteome in:

Proteome-pI is available under Creative Commons Attribution-NoDerivs license, for more details see here
| Reference: Kozlowski LP. Proteome-pI 2.0: Proteome Isoelectric Point Database Update. Nucleic Acids Res. 2021, doi: 10.1093/nar/gkab944 | Contact: Lukasz P. Kozlowski |