Cellulomonas aerilata
Taxonomy: cellular organisms; Bacteria; Terrabacteria group; Actinobacteria; Actinomycetia; Micrococcales; Cellulomonadaceae; Cellulomonas
Average proteome isoelectric point is 6.21
Get precalculated fractions of proteins
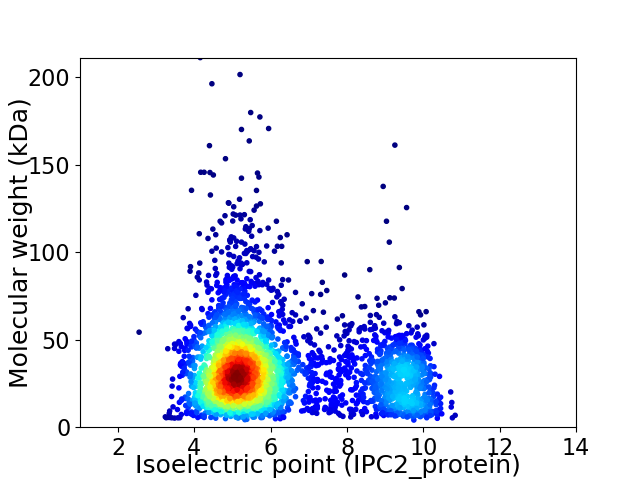
Virtual 2D-PAGE plot for 3577 proteins (isoelectric point calculated using IPC2_protein)
Get csv file with sequences according to given criteria:
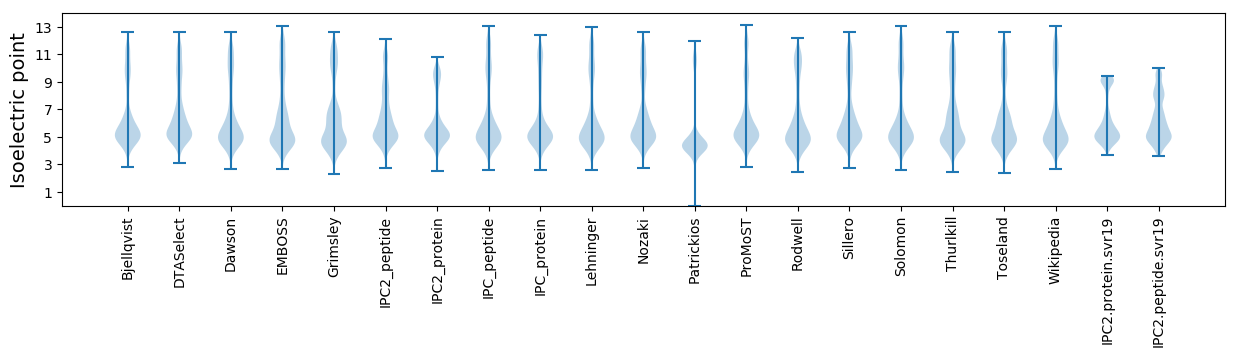
* You can choose from 21 different methods for calculating isoelectric point
Summary statistics related to proteome-wise predictions
Protein with the lowest isoelectric point:
>tr|A0A512D9F0|A0A512D9F0_9CELL Probable DNA ligase OS=Cellulomonas aerilata OX=515326 GN=lig_1 PE=3 SV=1
MM1 pKa = 6.69ITKK4 pKa = 9.65RR5 pKa = 11.84WSYY8 pKa = 9.12ATAVAAATAVVLAGCSASSSSEE30 pKa = 3.52PSASDD35 pKa = 3.79GPVTLTYY42 pKa = 10.27WDD44 pKa = 4.61FLDD47 pKa = 4.78PSQDD51 pKa = 3.46NPRR54 pKa = 11.84SNALEE59 pKa = 3.77EE60 pKa = 4.57NIANFEE66 pKa = 4.08AANPDD71 pKa = 2.96ITIDD75 pKa = 3.66LSVVSLGDD83 pKa = 3.26MLNRR87 pKa = 11.84LPQSAAAGQAPDD99 pKa = 3.63VFKK102 pKa = 10.68MFTPTVPQMAAAGAYY117 pKa = 10.09SPLPEE122 pKa = 4.63AASEE126 pKa = 3.99ITDD129 pKa = 3.51WLRR132 pKa = 11.84PPSNLVGPDD141 pKa = 3.59GQQVAVPYY149 pKa = 9.85EE150 pKa = 3.84YY151 pKa = 9.14RR152 pKa = 11.84TCAFYY157 pKa = 11.34YY158 pKa = 8.85NQKK161 pKa = 9.92ILDD164 pKa = 3.83QIGAEE169 pKa = 4.2VPTTYY174 pKa = 11.14EE175 pKa = 3.99DD176 pKa = 3.77VVDD179 pKa = 4.03VAGKK183 pKa = 10.36AGAAGFTGFGTGFSDD198 pKa = 3.65TDD200 pKa = 3.16NSAIISTFFDD210 pKa = 3.48CFMSQVGEE218 pKa = 4.65PIWNDD223 pKa = 3.11DD224 pKa = 3.84GEE226 pKa = 4.93AEE228 pKa = 4.3FAGTAADD235 pKa = 3.67EE236 pKa = 4.6FGQILADD243 pKa = 3.79LRR245 pKa = 11.84DD246 pKa = 3.73SGGLGTSVVSDD257 pKa = 3.73SYY259 pKa = 11.37STVTDD264 pKa = 3.59GLTNGTVAMAVLGSEE279 pKa = 4.38RR280 pKa = 11.84VITLTGANPDD290 pKa = 3.95IKK292 pKa = 9.95WGPLPEE298 pKa = 4.34PTSGGTTGATLGWTLGIGAGTDD320 pKa = 3.23HH321 pKa = 7.49TDD323 pKa = 3.4AAWKK327 pKa = 9.79FIEE330 pKa = 4.34YY331 pKa = 7.18MTGAEE336 pKa = 4.42AGAVMATGGEE346 pKa = 4.15IPTRR350 pKa = 11.84ASTYY354 pKa = 8.71DD355 pKa = 3.09AEE357 pKa = 4.52YY358 pKa = 10.48FSTPEE363 pKa = 3.85AEE365 pKa = 4.44TVKK368 pKa = 10.16TVADD372 pKa = 3.77YY373 pKa = 11.53VEE375 pKa = 5.2SNSEE379 pKa = 3.66PHH381 pKa = 6.54TYY383 pKa = 10.44SDD385 pKa = 3.42DD386 pKa = 4.1WIGVASGLSAAGQSLYY402 pKa = 11.17LNKK405 pKa = 10.14TSGSEE410 pKa = 4.38FITAAQDD417 pKa = 4.16AINEE421 pKa = 4.19
MM1 pKa = 6.69ITKK4 pKa = 9.65RR5 pKa = 11.84WSYY8 pKa = 9.12ATAVAAATAVVLAGCSASSSSEE30 pKa = 3.52PSASDD35 pKa = 3.79GPVTLTYY42 pKa = 10.27WDD44 pKa = 4.61FLDD47 pKa = 4.78PSQDD51 pKa = 3.46NPRR54 pKa = 11.84SNALEE59 pKa = 3.77EE60 pKa = 4.57NIANFEE66 pKa = 4.08AANPDD71 pKa = 2.96ITIDD75 pKa = 3.66LSVVSLGDD83 pKa = 3.26MLNRR87 pKa = 11.84LPQSAAAGQAPDD99 pKa = 3.63VFKK102 pKa = 10.68MFTPTVPQMAAAGAYY117 pKa = 10.09SPLPEE122 pKa = 4.63AASEE126 pKa = 3.99ITDD129 pKa = 3.51WLRR132 pKa = 11.84PPSNLVGPDD141 pKa = 3.59GQQVAVPYY149 pKa = 9.85EE150 pKa = 3.84YY151 pKa = 9.14RR152 pKa = 11.84TCAFYY157 pKa = 11.34YY158 pKa = 8.85NQKK161 pKa = 9.92ILDD164 pKa = 3.83QIGAEE169 pKa = 4.2VPTTYY174 pKa = 11.14EE175 pKa = 3.99DD176 pKa = 3.77VVDD179 pKa = 4.03VAGKK183 pKa = 10.36AGAAGFTGFGTGFSDD198 pKa = 3.65TDD200 pKa = 3.16NSAIISTFFDD210 pKa = 3.48CFMSQVGEE218 pKa = 4.65PIWNDD223 pKa = 3.11DD224 pKa = 3.84GEE226 pKa = 4.93AEE228 pKa = 4.3FAGTAADD235 pKa = 3.67EE236 pKa = 4.6FGQILADD243 pKa = 3.79LRR245 pKa = 11.84DD246 pKa = 3.73SGGLGTSVVSDD257 pKa = 3.73SYY259 pKa = 11.37STVTDD264 pKa = 3.59GLTNGTVAMAVLGSEE279 pKa = 4.38RR280 pKa = 11.84VITLTGANPDD290 pKa = 3.95IKK292 pKa = 9.95WGPLPEE298 pKa = 4.34PTSGGTTGATLGWTLGIGAGTDD320 pKa = 3.23HH321 pKa = 7.49TDD323 pKa = 3.4AAWKK327 pKa = 9.79FIEE330 pKa = 4.34YY331 pKa = 7.18MTGAEE336 pKa = 4.42AGAVMATGGEE346 pKa = 4.15IPTRR350 pKa = 11.84ASTYY354 pKa = 8.71DD355 pKa = 3.09AEE357 pKa = 4.52YY358 pKa = 10.48FSTPEE363 pKa = 3.85AEE365 pKa = 4.44TVKK368 pKa = 10.16TVADD372 pKa = 3.77YY373 pKa = 11.53VEE375 pKa = 5.2SNSEE379 pKa = 3.66PHH381 pKa = 6.54TYY383 pKa = 10.44SDD385 pKa = 3.42DD386 pKa = 4.1WIGVASGLSAAGQSLYY402 pKa = 11.17LNKK405 pKa = 10.14TSGSEE410 pKa = 4.38FITAAQDD417 pKa = 4.16AINEE421 pKa = 4.19
Molecular weight: 43.89 kDa
Isoelectric point according different methods:
Protein with the highest isoelectric point:
>tr|A0A512DFF7|A0A512DFF7_9CELL Cytidylate kinase OS=Cellulomonas aerilata OX=515326 GN=cmk PE=3 SV=1
MM1 pKa = 7.67SKK3 pKa = 10.15PAQLVLGVVLIVMGAVFTLQGLGVLAGSPMTGATLWAVVGPVLVVVGLVMVVRR56 pKa = 11.84AARR59 pKa = 11.84TRR61 pKa = 11.84GPGRR65 pKa = 11.84PRR67 pKa = 3.59
MM1 pKa = 7.67SKK3 pKa = 10.15PAQLVLGVVLIVMGAVFTLQGLGVLAGSPMTGATLWAVVGPVLVVVGLVMVVRR56 pKa = 11.84AARR59 pKa = 11.84TRR61 pKa = 11.84GPGRR65 pKa = 11.84PRR67 pKa = 3.59
Molecular weight: 6.79 kDa
Isoelectric point according different methods:
Peptides (in silico digests for buttom-up proteomics)
Below you can find in silico digests of the whole proteome with Trypsin, Chymotrypsin, Trypsin+LysC, LysN, ArgC proteases suitable for different mass spec machines.| Try ESI |
 |
|---|
| ChTry ESI |
|
|---|
| ArgC ESI |
|
|---|
| LysN ESI |
|
|---|
| TryLysC ESI |
|
|---|
| Try MALDI |
|
|---|
| ChTry MALDI |
|
|---|
| ArgC MALDI |
|
|---|
| LysN MALDI |
|
|---|
| TryLysC MALDI |
|
|---|
| Try LTQ |
|
|---|
| ChTry LTQ |
|
|---|
| ArgC LTQ |
|
|---|
| LysN LTQ |
|
|---|
| TryLysC LTQ |
|
|---|
| Try MSlow |
|
|---|
| ChTry MSlow |
|
|---|
| ArgC MSlow |
|
|---|
| LysN MSlow |
|
|---|
| TryLysC MSlow |
|
|---|
| Try MShigh |
|
|---|
| ChTry MShigh |
|
|---|
| ArgC MShigh |
|
|---|
| LysN MShigh |
|
|---|
| TryLysC MShigh |
|
|---|
General Statistics
Number of major isoforms |
Number of additional isoforms |
Number of all proteins |
Number of amino acids |
Min. Seq. Length |
Max. Seq. Length |
Avg. Seq. Length |
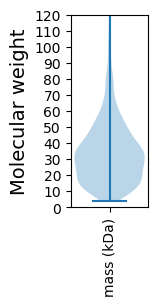
Avg. Mol. Weight |
|---|---|---|---|---|---|---|---|
0 |
1211180 |
39 |
2028 |
338.6 |
35.77 |
Amino acid frequency
Ala |
Cys |
Asp |
Glu |
Phe |
Gly |
His |
Ile |
Lys |
Leu |
|---|---|---|---|---|---|---|---|---|---|
14.545 ± 0.069 | 0.556 ± 0.009 |
6.474 ± 0.039 | 5.092 ± 0.037 |
2.424 ± 0.024 | 9.749 ± 0.041 |
2.135 ± 0.022 | 2.687 ± 0.03 |
1.217 ± 0.024 | 10.294 ± 0.05 |
Met |
Asn |
Gln |
Pro |
Arg |
Ser |
Thr |
Val |
Trp |
Tyr |
|---|---|---|---|---|---|---|---|---|---|
1.571 ± 0.014 | 1.402 ± 0.024 |
6.312 ± 0.041 | 2.59 ± 0.022 |
8.135 ± 0.036 | 4.963 ± 0.029 |
6.405 ± 0.036 | 10.246 ± 0.044 |
1.46 ± 0.016 | 1.743 ± 0.021 |
Most of the basic statistics you can see at this page can be downloaded from this CSV file
See this proteome in:

Proteome-pI is available under Creative Commons Attribution-NoDerivs license, for more details see here
| Reference: Kozlowski LP. Proteome-pI 2.0: Proteome Isoelectric Point Database Update. Nucleic Acids Res. 2021, doi: 10.1093/nar/gkab944 | Contact: Lukasz P. Kozlowski |