Trachipleistophora hominis (Microsporidian parasite)
Taxonomy: cellular organisms; Eukaryota; Opisthokonta; Fungi; Fungi incertae sedis; Microsporidia; Pansporoblastina; Pleistophoridae; Trachipleistophora
Average proteome isoelectric point is 7.01
Get precalculated fractions of proteins
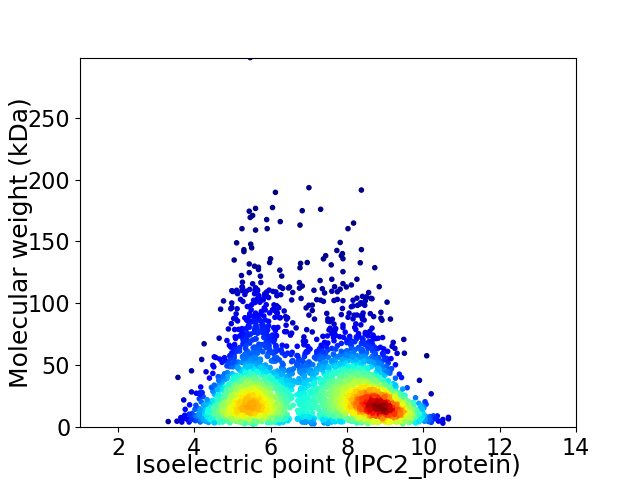
Virtual 2D-PAGE plot for 3212 proteins (isoelectric point calculated using IPC2_protein)
Get csv file with sequences according to given criteria:
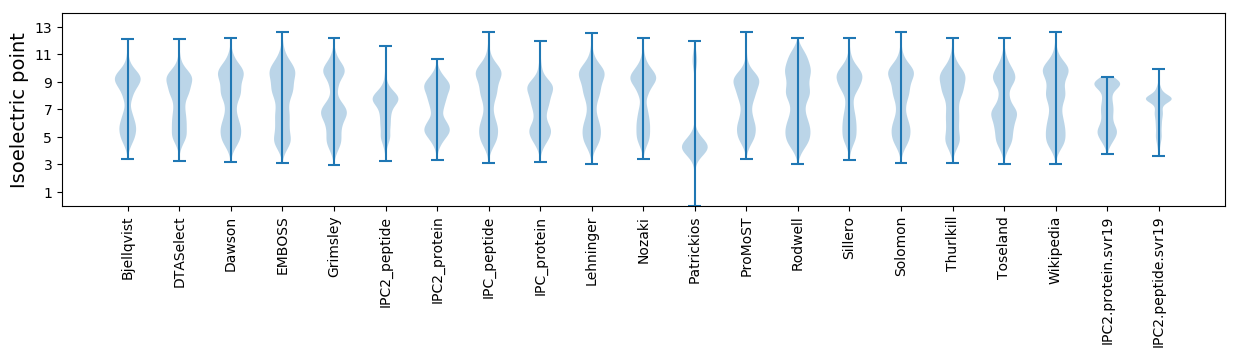
* You can choose from 21 different methods for calculating isoelectric point
Summary statistics related to proteome-wise predictions
Protein with the lowest isoelectric point:
>tr|L7JUU9|L7JUU9_TRAHO Putative bZIP transcription factor OS=Trachipleistophora hominis OX=72359 GN=THOM_1906 PE=4 SV=1
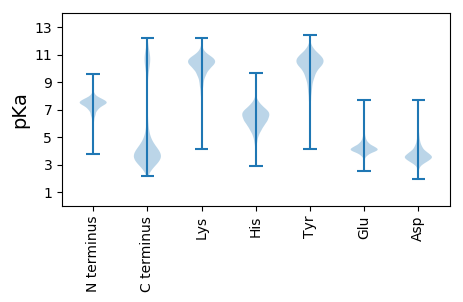
MM1 pKa = 7.44NFLEE5 pKa = 4.45YY6 pKa = 10.66LVLEE10 pKa = 4.62CKK12 pKa = 10.02RR13 pKa = 11.84RR14 pKa = 11.84LLSTYY19 pKa = 10.77SSTNNILQEE28 pKa = 3.93PQAAQMNCNVYY39 pKa = 10.44QNEE42 pKa = 4.02NAFRR46 pKa = 11.84RR47 pKa = 11.84EE48 pKa = 3.59MSMVFLMFSVMFIIWFLLMYY68 pKa = 10.21FCLTKK73 pKa = 10.35TPYY76 pKa = 9.53QQPDD80 pKa = 3.16THH82 pKa = 8.01SEE84 pKa = 3.71QEE86 pKa = 4.24YY87 pKa = 9.55VVEE90 pKa = 4.3IGEE93 pKa = 4.36NNSLMSLNSNQEE105 pKa = 3.66NNARR109 pKa = 11.84PQSEE113 pKa = 4.0ASVDD117 pKa = 3.58GHH119 pKa = 6.8HH120 pKa = 6.84VDD122 pKa = 4.74SPLSYY127 pKa = 10.98DD128 pKa = 3.56RR129 pKa = 11.84NNDD132 pKa = 2.87EE133 pKa = 5.34DD134 pKa = 4.73LYY136 pKa = 11.41EE137 pKa = 4.94EE138 pKa = 4.48IPSTEE143 pKa = 3.9SSSFSVFSDD152 pKa = 3.16DD153 pKa = 3.77TRR155 pKa = 11.84SFDD158 pKa = 3.61TDD160 pKa = 3.54SQITPEE166 pKa = 4.14YY167 pKa = 9.29TLLPSPFLDD176 pKa = 3.37IEE178 pKa = 4.34LLLFVHH184 pKa = 6.46NLLDD188 pKa = 3.75RR189 pKa = 11.84TSSSTSADD197 pKa = 3.48DD198 pKa = 5.02DD199 pKa = 3.94NAQITSPRR207 pKa = 11.84IQLIDD212 pKa = 3.93SNVSQLDD219 pKa = 3.24IEE221 pKa = 5.16LNLFLNLQMDD231 pKa = 4.22SDD233 pKa = 4.66DD234 pKa = 4.67LPSNSSSLEE243 pKa = 4.12VINTEE248 pKa = 3.9
MM1 pKa = 7.44NFLEE5 pKa = 4.45YY6 pKa = 10.66LVLEE10 pKa = 4.62CKK12 pKa = 10.02RR13 pKa = 11.84RR14 pKa = 11.84LLSTYY19 pKa = 10.77SSTNNILQEE28 pKa = 3.93PQAAQMNCNVYY39 pKa = 10.44QNEE42 pKa = 4.02NAFRR46 pKa = 11.84RR47 pKa = 11.84EE48 pKa = 3.59MSMVFLMFSVMFIIWFLLMYY68 pKa = 10.21FCLTKK73 pKa = 10.35TPYY76 pKa = 9.53QQPDD80 pKa = 3.16THH82 pKa = 8.01SEE84 pKa = 3.71QEE86 pKa = 4.24YY87 pKa = 9.55VVEE90 pKa = 4.3IGEE93 pKa = 4.36NNSLMSLNSNQEE105 pKa = 3.66NNARR109 pKa = 11.84PQSEE113 pKa = 4.0ASVDD117 pKa = 3.58GHH119 pKa = 6.8HH120 pKa = 6.84VDD122 pKa = 4.74SPLSYY127 pKa = 10.98DD128 pKa = 3.56RR129 pKa = 11.84NNDD132 pKa = 2.87EE133 pKa = 5.34DD134 pKa = 4.73LYY136 pKa = 11.41EE137 pKa = 4.94EE138 pKa = 4.48IPSTEE143 pKa = 3.9SSSFSVFSDD152 pKa = 3.16DD153 pKa = 3.77TRR155 pKa = 11.84SFDD158 pKa = 3.61TDD160 pKa = 3.54SQITPEE166 pKa = 4.14YY167 pKa = 9.29TLLPSPFLDD176 pKa = 3.37IEE178 pKa = 4.34LLLFVHH184 pKa = 6.46NLLDD188 pKa = 3.75RR189 pKa = 11.84TSSSTSADD197 pKa = 3.48DD198 pKa = 5.02DD199 pKa = 3.94NAQITSPRR207 pKa = 11.84IQLIDD212 pKa = 3.93SNVSQLDD219 pKa = 3.24IEE221 pKa = 5.16LNLFLNLQMDD231 pKa = 4.22SDD233 pKa = 4.66DD234 pKa = 4.67LPSNSSSLEE243 pKa = 4.12VINTEE248 pKa = 3.9
Molecular weight: 28.47 kDa
Isoelectric point according different methods:
Protein with the highest isoelectric point:
>tr|L7JXT7|L7JXT7_TRAHO Tubulin gamma chain OS=Trachipleistophora hominis OX=72359 GN=THOM_0785 PE=3 SV=1
MM1 pKa = 7.6LSLEE5 pKa = 4.16VLEE8 pKa = 5.37VITGCVWAGMLCMAVKK24 pKa = 10.34VWRR27 pKa = 11.84LLDD30 pKa = 3.93GKK32 pKa = 10.23LDD34 pKa = 4.06CGLVRR39 pKa = 11.84MMGMLILLMLRR50 pKa = 11.84LFMKK54 pKa = 10.19IRR56 pKa = 11.84LEE58 pKa = 4.18GGVGGSRR65 pKa = 11.84DD66 pKa = 3.44VGGDD70 pKa = 3.04RR71 pKa = 11.84DD72 pKa = 3.84GGVGRR77 pKa = 11.84GRR79 pKa = 11.84NGGVWRR85 pKa = 11.84DD86 pKa = 3.37RR87 pKa = 11.84NGGVGRR93 pKa = 11.84DD94 pKa = 3.32RR95 pKa = 11.84NGGVGRR101 pKa = 11.84DD102 pKa = 3.34RR103 pKa = 11.84NGGVWRR109 pKa = 11.84NPLGRR114 pKa = 11.84DD115 pKa = 3.46YY116 pKa = 11.15NTT118 pKa = 3.87
MM1 pKa = 7.6LSLEE5 pKa = 4.16VLEE8 pKa = 5.37VITGCVWAGMLCMAVKK24 pKa = 10.34VWRR27 pKa = 11.84LLDD30 pKa = 3.93GKK32 pKa = 10.23LDD34 pKa = 4.06CGLVRR39 pKa = 11.84MMGMLILLMLRR50 pKa = 11.84LFMKK54 pKa = 10.19IRR56 pKa = 11.84LEE58 pKa = 4.18GGVGGSRR65 pKa = 11.84DD66 pKa = 3.44VGGDD70 pKa = 3.04RR71 pKa = 11.84DD72 pKa = 3.84GGVGRR77 pKa = 11.84GRR79 pKa = 11.84NGGVWRR85 pKa = 11.84DD86 pKa = 3.37RR87 pKa = 11.84NGGVGRR93 pKa = 11.84DD94 pKa = 3.32RR95 pKa = 11.84NGGVGRR101 pKa = 11.84DD102 pKa = 3.34RR103 pKa = 11.84NGGVWRR109 pKa = 11.84NPLGRR114 pKa = 11.84DD115 pKa = 3.46YY116 pKa = 11.15NTT118 pKa = 3.87
Molecular weight: 12.85 kDa
Isoelectric point according different methods:
Peptides (in silico digests for buttom-up proteomics)
Below you can find in silico digests of the whole proteome with Trypsin, Chymotrypsin, Trypsin+LysC, LysN, ArgC proteases suitable for different mass spec machines.| Try ESI |
 |
|---|
| ChTry ESI |
|
|---|
| ArgC ESI |
|
|---|
| LysN ESI |
|
|---|
| TryLysC ESI |
|
|---|
| Try MALDI |
|
|---|
| ChTry MALDI |
|
|---|
| ArgC MALDI |
|
|---|
| LysN MALDI |
|
|---|
| TryLysC MALDI |
|
|---|
| Try LTQ |
|
|---|
| ChTry LTQ |
|
|---|
| ArgC LTQ |
|
|---|
| LysN LTQ |
|
|---|
| TryLysC LTQ |
|
|---|
| Try MSlow |
|
|---|
| ChTry MSlow |
|
|---|
| ArgC MSlow |
|
|---|
| LysN MSlow |
|
|---|
| TryLysC MSlow |
|
|---|
| Try MShigh |
|
|---|
| ChTry MShigh |
|
|---|
| ArgC MShigh |
|
|---|
| LysN MShigh |
|
|---|
| TryLysC MShigh |
|
|---|
General Statistics
Number of major isoforms |
Number of additional isoforms |
Number of all proteins |
Number of amino acids |
Min. Seq. Length |
Max. Seq. Length |
Avg. Seq. Length |
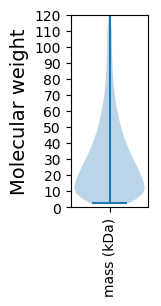
Avg. Mol. Weight |
|---|---|---|---|---|---|---|---|
0 |
933265 |
21 |
2764 |
290.6 |
33.07 |
Amino acid frequency
Ala |
Cys |
Asp |
Glu |
Phe |
Gly |
His |
Ile |
Lys |
Leu |
|---|---|---|---|---|---|---|---|---|---|
4.404 ± 0.043 | 2.095 ± 0.021 |
5.838 ± 0.038 | 7.13 ± 0.054 |
4.813 ± 0.039 | 4.587 ± 0.051 |
2.078 ± 0.016 | 7.266 ± 0.052 |
8.224 ± 0.06 | 9.11 ± 0.058 |
Met |
Asn |
Gln |
Pro |
Arg |
Ser |
Thr |
Val |
Trp |
Tyr |
|---|---|---|---|---|---|---|---|---|---|
2.722 ± 0.018 | 6.622 ± 0.045 |
2.708 ± 0.031 | 2.761 ± 0.023 |
5.32 ± 0.038 | 6.664 ± 0.043 |
5.168 ± 0.03 | 6.672 ± 0.041 |
0.595 ± 0.011 | 4.026 ± 0.028 |
Most of the basic statistics you can see at this page can be downloaded from this CSV file
See this proteome in:

Proteome-pI is available under Creative Commons Attribution-NoDerivs license, for more details see here
| Reference: Kozlowski LP. Proteome-pI 2.0: Proteome Isoelectric Point Database Update. Nucleic Acids Res. 2021, doi: 10.1093/nar/gkab944 | Contact: Lukasz P. Kozlowski |