Streptococcus satellite phage Javan16
Taxonomy: Viruses; Duplodnaviria; Heunggongvirae; Uroviricota; Caudoviricetes; Caudovirales; Siphoviridae; unclassified Siphoviridae
Average proteome isoelectric point is 6.42
Get precalculated fractions of proteins
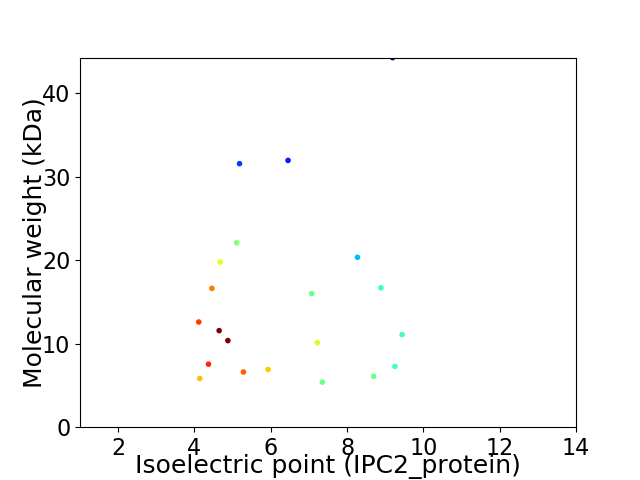
Virtual 2D-PAGE plot for 21 proteins (isoelectric point calculated using IPC2_protein)
Get csv file with sequences according to given criteria:
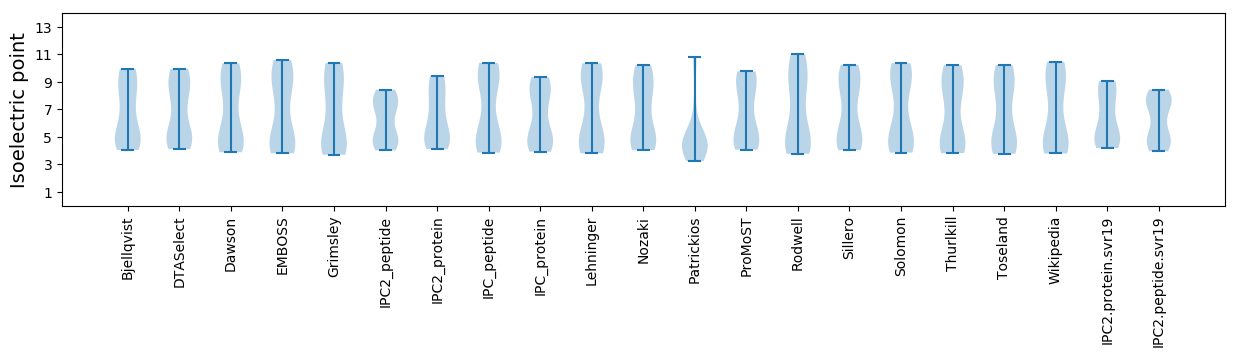
* You can choose from 21 different methods for calculating isoelectric point
Summary statistics related to proteome-wise predictions
Protein with the lowest isoelectric point:
>tr|A0A4D5ZEQ0|A0A4D5ZEQ0_9VIRU Uncharacterized protein OS=Streptococcus satellite phage Javan16 OX=2558548 GN=JavanS16_0016 PE=4 SV=1
MM1 pKa = 7.56NEE3 pKa = 4.02LNLTPTQSIILIIVCLVILVLLLHH27 pKa = 6.15YY28 pKa = 10.5EE29 pKa = 4.08SDD31 pKa = 3.58IEE33 pKa = 5.66LDD35 pKa = 3.49LTPQIDD41 pKa = 3.93EE42 pKa = 4.43VEE44 pKa = 4.4EE45 pKa = 4.17KK46 pKa = 10.18TKK48 pKa = 9.43QTTT51 pKa = 3.06
MM1 pKa = 7.56NEE3 pKa = 4.02LNLTPTQSIILIIVCLVILVLLLHH27 pKa = 6.15YY28 pKa = 10.5EE29 pKa = 4.08SDD31 pKa = 3.58IEE33 pKa = 5.66LDD35 pKa = 3.49LTPQIDD41 pKa = 3.93EE42 pKa = 4.43VEE44 pKa = 4.4EE45 pKa = 4.17KK46 pKa = 10.18TKK48 pKa = 9.43QTTT51 pKa = 3.06
Molecular weight: 5.84 kDa
Isoelectric point according different methods:
Protein with the highest isoelectric point:
>tr|A0A4D5ZJH4|A0A4D5ZJH4_9VIRU Uncharacterized protein OS=Streptococcus satellite phage Javan16 OX=2558548 GN=JavanS16_0013 PE=4 SV=1
MM1 pKa = 7.75IITVEE6 pKa = 3.73IAEE9 pKa = 4.24KK10 pKa = 10.75VRR12 pKa = 11.84IKK14 pKa = 10.48RR15 pKa = 11.84ARR17 pKa = 11.84LSMTKK22 pKa = 9.41TKK24 pKa = 10.61LSEE27 pKa = 3.94KK28 pKa = 10.48LGIARR33 pKa = 11.84QTLVKK38 pKa = 9.89IEE40 pKa = 3.92KK41 pKa = 9.93GQYY44 pKa = 8.6KK45 pKa = 9.61CPKK48 pKa = 9.34RR49 pKa = 11.84IYY51 pKa = 9.33EE52 pKa = 4.66SVMTWLVEE60 pKa = 4.49EE61 pKa = 4.4II62 pKa = 4.06
MM1 pKa = 7.75IITVEE6 pKa = 3.73IAEE9 pKa = 4.24KK10 pKa = 10.75VRR12 pKa = 11.84IKK14 pKa = 10.48RR15 pKa = 11.84ARR17 pKa = 11.84LSMTKK22 pKa = 9.41TKK24 pKa = 10.61LSEE27 pKa = 3.94KK28 pKa = 10.48LGIARR33 pKa = 11.84QTLVKK38 pKa = 9.89IEE40 pKa = 3.92KK41 pKa = 9.93GQYY44 pKa = 8.6KK45 pKa = 9.61CPKK48 pKa = 9.34RR49 pKa = 11.84IYY51 pKa = 9.33EE52 pKa = 4.66SVMTWLVEE60 pKa = 4.49EE61 pKa = 4.4II62 pKa = 4.06
Molecular weight: 7.28 kDa
Isoelectric point according different methods:
Peptides (in silico digests for buttom-up proteomics)
Below you can find in silico digests of the whole proteome with Trypsin, Chymotrypsin, Trypsin+LysC, LysN, ArgC proteases suitable for different mass spec machines.| Try ESI |
 |
|---|
| ChTry ESI |
|
|---|
| ArgC ESI |
|
|---|
| LysN ESI |
|
|---|
| TryLysC ESI |
|
|---|
| Try MALDI |
|
|---|
| ChTry MALDI |
|
|---|
| ArgC MALDI |
|
|---|
| LysN MALDI |
|
|---|
| TryLysC MALDI |
|
|---|
| Try LTQ |
|
|---|
| ChTry LTQ |
|
|---|
| ArgC LTQ |
|
|---|
| LysN LTQ |
|
|---|
| TryLysC LTQ |
|
|---|
| Try MSlow |
|
|---|
| ChTry MSlow |
|
|---|
| ArgC MSlow |
|
|---|
| LysN MSlow |
|
|---|
| TryLysC MSlow |
|
|---|
| Try MShigh |
|
|---|
| ChTry MShigh |
|
|---|
| ArgC MShigh |
|
|---|
| LysN MShigh |
|
|---|
| TryLysC MShigh |
|
|---|
General Statistics
Number of major isoforms |
Number of additional isoforms |
Number of all proteins |
Number of amino acids |
Min. Seq. Length |
Max. Seq. Length |
Avg. Seq. Length |
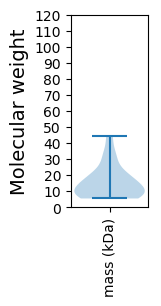
Avg. Mol. Weight |
|---|---|---|---|---|---|---|---|
0 |
2781 |
46 |
387 |
132.4 |
15.28 |
Amino acid frequency
Ala |
Cys |
Asp |
Glu |
Phe |
Gly |
His |
Ile |
Lys |
Leu |
|---|---|---|---|---|---|---|---|---|---|
5.322 ± 0.482 | 0.539 ± 0.126 |
6.149 ± 0.477 | 7.911 ± 0.678 |
3.919 ± 0.403 | 4.171 ± 0.235 |
1.618 ± 0.25 | 7.3 ± 0.662 |
9.097 ± 0.49 | 9.781 ± 0.534 |
Met |
Asn |
Gln |
Pro |
Arg |
Ser |
Thr |
Val |
Trp |
Tyr |
|---|---|---|---|---|---|---|---|---|---|
2.625 ± 0.221 | 6.257 ± 0.492 |
2.733 ± 0.218 | 4.818 ± 0.501 |
4.171 ± 0.365 | 6.077 ± 0.373 |
6.149 ± 0.41 | 6.149 ± 0.401 |
1.043 ± 0.216 | 4.171 ± 0.398 |
Most of the basic statistics you can see at this page can be downloaded from this CSV file
See this proteome in:

Proteome-pI is available under Creative Commons Attribution-NoDerivs license, for more details see here
| Reference: Kozlowski LP. Proteome-pI 2.0: Proteome Isoelectric Point Database Update. Nucleic Acids Res. 2021, doi: 10.1093/nar/gkab944 | Contact: Lukasz P. Kozlowski |