Thauera sp. (strain MZ1T)
Taxonomy: cellular organisms; Bacteria; Proteobacteria; Betaproteobacteria; Rhodocyclales; Zoogloeaceae; Thauera; unclassified Thauera
Average proteome isoelectric point is 6.66
Get precalculated fractions of proteins
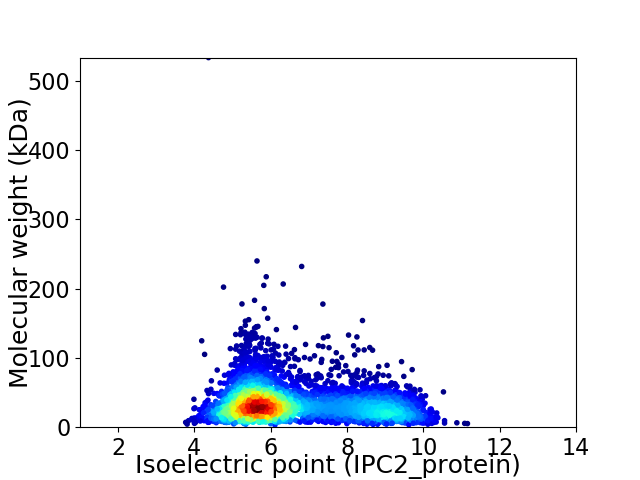
Virtual 2D-PAGE plot for 3927 proteins (isoelectric point calculated using IPC2_protein)
Get csv file with sequences according to given criteria:
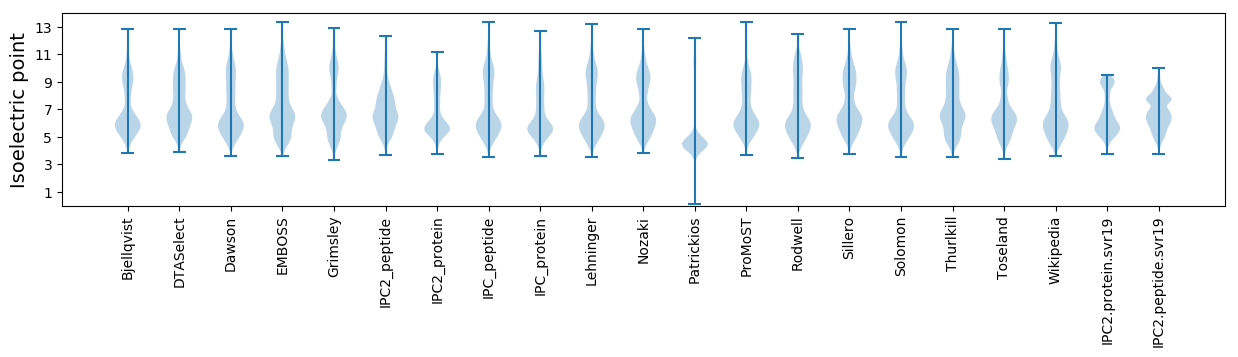
* You can choose from 21 different methods for calculating isoelectric point
Summary statistics related to proteome-wise predictions
Protein with the lowest isoelectric point:
>tr|C4ZJM1|C4ZJM1_THASP Aldo/keto reductase OS=Thauera sp. (strain MZ1T) OX=85643 GN=Tmz1t_1648 PE=4 SV=1
MM1 pKa = 7.41KK2 pKa = 10.45AKK4 pKa = 10.29NLVVAMLAALGASSASAALVNLNGLGYY31 pKa = 8.69VTYY34 pKa = 10.9GDD36 pKa = 3.95GNSYY40 pKa = 10.98SLAVANYY47 pKa = 7.04FACGSEE53 pKa = 4.06YY54 pKa = 11.14GPGCPYY60 pKa = 10.36NVKK63 pKa = 10.19GSPGASEE70 pKa = 4.22TDD72 pKa = 3.1PRR74 pKa = 11.84IYY76 pKa = 10.08IVQGAGGHH84 pKa = 5.59VDD86 pKa = 3.66NEE88 pKa = 4.08NANIDD93 pKa = 4.04DD94 pKa = 5.19AFDD97 pKa = 3.63AANNEE102 pKa = 4.28LFFTMTSANEE112 pKa = 4.02PGSDD116 pKa = 3.45GNKK119 pKa = 9.66NATFTGDD126 pKa = 3.87KK127 pKa = 10.14TNTWDD132 pKa = 3.45ATLGALDD139 pKa = 3.81QSFDD143 pKa = 3.5FSKK146 pKa = 11.44NLMTFFFVNNEE157 pKa = 4.02PNSNDD162 pKa = 3.4GLTQNLAVWARR173 pKa = 11.84VTLTNLAGTTVYY185 pKa = 9.21KK186 pKa = 10.62TFDD189 pKa = 3.39VTNDD193 pKa = 2.97PRR195 pKa = 11.84TSEE198 pKa = 3.89QRR200 pKa = 11.84DD201 pKa = 3.21GDD203 pKa = 4.38GIGDD207 pKa = 4.6LPAPGYY213 pKa = 10.25GPPPVGGGVPYY224 pKa = 11.06GDD226 pKa = 3.23VTLYY230 pKa = 10.39TSEE233 pKa = 4.36SNAPEE238 pKa = 3.75ITDD241 pKa = 3.75FAMSGGQVCVDD252 pKa = 3.97EE253 pKa = 4.4NTSTLVDD260 pKa = 3.98CTTASAGSFDD270 pKa = 5.76AINHH274 pKa = 5.91NLGEE278 pKa = 4.16NQAPYY283 pKa = 10.64AITIPEE289 pKa = 4.46LDD291 pKa = 4.33DD292 pKa = 4.26YY293 pKa = 11.59IGGLMAANANLDD305 pKa = 4.05DD306 pKa = 3.76YY307 pKa = 11.78VMRR310 pKa = 11.84VDD312 pKa = 4.68LRR314 pKa = 11.84YY315 pKa = 10.56GCVSPPFTIDD325 pKa = 3.02TQGNDD330 pKa = 2.86SCVGYY335 pKa = 8.41GTAVSQDD342 pKa = 3.26NNFEE346 pKa = 4.13QVFISTRR353 pKa = 11.84LATQRR358 pKa = 11.84VPEE361 pKa = 4.8PGTLALLGSGLLGFAAARR379 pKa = 11.84RR380 pKa = 11.84SRR382 pKa = 11.84KK383 pKa = 9.09SS384 pKa = 2.98
MM1 pKa = 7.41KK2 pKa = 10.45AKK4 pKa = 10.29NLVVAMLAALGASSASAALVNLNGLGYY31 pKa = 8.69VTYY34 pKa = 10.9GDD36 pKa = 3.95GNSYY40 pKa = 10.98SLAVANYY47 pKa = 7.04FACGSEE53 pKa = 4.06YY54 pKa = 11.14GPGCPYY60 pKa = 10.36NVKK63 pKa = 10.19GSPGASEE70 pKa = 4.22TDD72 pKa = 3.1PRR74 pKa = 11.84IYY76 pKa = 10.08IVQGAGGHH84 pKa = 5.59VDD86 pKa = 3.66NEE88 pKa = 4.08NANIDD93 pKa = 4.04DD94 pKa = 5.19AFDD97 pKa = 3.63AANNEE102 pKa = 4.28LFFTMTSANEE112 pKa = 4.02PGSDD116 pKa = 3.45GNKK119 pKa = 9.66NATFTGDD126 pKa = 3.87KK127 pKa = 10.14TNTWDD132 pKa = 3.45ATLGALDD139 pKa = 3.81QSFDD143 pKa = 3.5FSKK146 pKa = 11.44NLMTFFFVNNEE157 pKa = 4.02PNSNDD162 pKa = 3.4GLTQNLAVWARR173 pKa = 11.84VTLTNLAGTTVYY185 pKa = 9.21KK186 pKa = 10.62TFDD189 pKa = 3.39VTNDD193 pKa = 2.97PRR195 pKa = 11.84TSEE198 pKa = 3.89QRR200 pKa = 11.84DD201 pKa = 3.21GDD203 pKa = 4.38GIGDD207 pKa = 4.6LPAPGYY213 pKa = 10.25GPPPVGGGVPYY224 pKa = 11.06GDD226 pKa = 3.23VTLYY230 pKa = 10.39TSEE233 pKa = 4.36SNAPEE238 pKa = 3.75ITDD241 pKa = 3.75FAMSGGQVCVDD252 pKa = 3.97EE253 pKa = 4.4NTSTLVDD260 pKa = 3.98CTTASAGSFDD270 pKa = 5.76AINHH274 pKa = 5.91NLGEE278 pKa = 4.16NQAPYY283 pKa = 10.64AITIPEE289 pKa = 4.46LDD291 pKa = 4.33DD292 pKa = 4.26YY293 pKa = 11.59IGGLMAANANLDD305 pKa = 4.05DD306 pKa = 3.76YY307 pKa = 11.78VMRR310 pKa = 11.84VDD312 pKa = 4.68LRR314 pKa = 11.84YY315 pKa = 10.56GCVSPPFTIDD325 pKa = 3.02TQGNDD330 pKa = 2.86SCVGYY335 pKa = 8.41GTAVSQDD342 pKa = 3.26NNFEE346 pKa = 4.13QVFISTRR353 pKa = 11.84LATQRR358 pKa = 11.84VPEE361 pKa = 4.8PGTLALLGSGLLGFAAARR379 pKa = 11.84RR380 pKa = 11.84SRR382 pKa = 11.84KK383 pKa = 9.09SS384 pKa = 2.98
Molecular weight: 40.31 kDa
Isoelectric point according different methods:
Protein with the highest isoelectric point:
>tr|C4ZJF4|C4ZJF4_THASP Uncharacterized protein OS=Thauera sp. (strain MZ1T) OX=85643 GN=Tmz1t_1128 PE=4 SV=1
MM1 pKa = 7.22NGKK4 pKa = 8.97HH5 pKa = 6.13PAQGTHH11 pKa = 5.76SPAIGAGRR19 pKa = 11.84RR20 pKa = 11.84SLQQRR25 pKa = 11.84LLALRR30 pKa = 11.84AGLRR34 pKa = 11.84AALRR38 pKa = 11.84AFRR41 pKa = 11.84THH43 pKa = 7.53PIKK46 pKa = 10.75HH47 pKa = 5.49PQRR50 pKa = 5.12
MM1 pKa = 7.22NGKK4 pKa = 8.97HH5 pKa = 6.13PAQGTHH11 pKa = 5.76SPAIGAGRR19 pKa = 11.84RR20 pKa = 11.84SLQQRR25 pKa = 11.84LLALRR30 pKa = 11.84AGLRR34 pKa = 11.84AALRR38 pKa = 11.84AFRR41 pKa = 11.84THH43 pKa = 7.53PIKK46 pKa = 10.75HH47 pKa = 5.49PQRR50 pKa = 5.12
Molecular weight: 5.5 kDa
Isoelectric point according different methods:
Peptides (in silico digests for buttom-up proteomics)
Below you can find in silico digests of the whole proteome with Trypsin, Chymotrypsin, Trypsin+LysC, LysN, ArgC proteases suitable for different mass spec machines.| Try ESI |
 |
|---|
| ChTry ESI |
|
|---|
| ArgC ESI |
|
|---|
| LysN ESI |
|
|---|
| TryLysC ESI |
|
|---|
| Try MALDI |
|
|---|
| ChTry MALDI |
|
|---|
| ArgC MALDI |
|
|---|
| LysN MALDI |
|
|---|
| TryLysC MALDI |
|
|---|
| Try LTQ |
|
|---|
| ChTry LTQ |
|
|---|
| ArgC LTQ |
|
|---|
| LysN LTQ |
|
|---|
| TryLysC LTQ |
|
|---|
| Try MSlow |
|
|---|
| ChTry MSlow |
|
|---|
| ArgC MSlow |
|
|---|
| LysN MSlow |
|
|---|
| TryLysC MSlow |
|
|---|
| Try MShigh |
|
|---|
| ChTry MShigh |
|
|---|
| ArgC MShigh |
|
|---|
| LysN MShigh |
|
|---|
| TryLysC MShigh |
|
|---|
General Statistics
Number of major isoforms |
Number of additional isoforms |
Number of all proteins |
Number of amino acids |
Min. Seq. Length |
Max. Seq. Length |
Avg. Seq. Length |
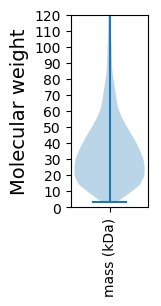
Avg. Mol. Weight |
|---|---|---|---|---|---|---|---|
0 |
1335952 |
31 |
5342 |
340.2 |
36.99 |
Amino acid frequency
Ala |
Cys |
Asp |
Glu |
Phe |
Gly |
His |
Ile |
Lys |
Leu |
|---|---|---|---|---|---|---|---|---|---|
13.347 ± 0.06 | 0.979 ± 0.016 |
5.456 ± 0.028 | 6.061 ± 0.037 |
3.558 ± 0.021 | 8.474 ± 0.037 |
2.307 ± 0.02 | 4.413 ± 0.026 |
2.829 ± 0.03 | 11.136 ± 0.052 |
Met |
Asn |
Gln |
Pro |
Arg |
Ser |
Thr |
Val |
Trp |
Tyr |
|---|---|---|---|---|---|---|---|---|---|
2.282 ± 0.018 | 2.284 ± 0.021 |
5.207 ± 0.03 | 3.233 ± 0.022 |
7.966 ± 0.045 | 4.794 ± 0.03 |
4.631 ± 0.026 | 7.516 ± 0.034 |
1.411 ± 0.016 | 2.117 ± 0.017 |
Most of the basic statistics you can see at this page can be downloaded from this CSV file
See this proteome in:

Proteome-pI is available under Creative Commons Attribution-NoDerivs license, for more details see here
| Reference: Kozlowski LP. Proteome-pI 2.0: Proteome Isoelectric Point Database Update. Nucleic Acids Res. 2021, doi: 10.1093/nar/gkab944 | Contact: Lukasz P. Kozlowski |