Streptomyces thermoautotrophicus
Taxonomy:
Average proteome isoelectric point is 6.7
Get precalculated fractions of proteins
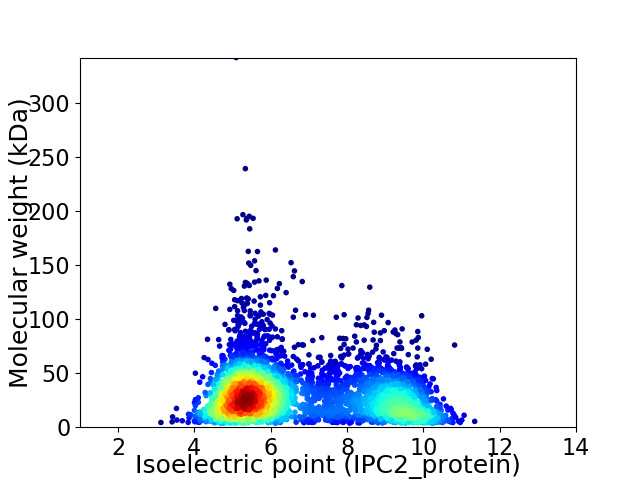
Virtual 2D-PAGE plot for 4356 proteins (isoelectric point calculated using IPC2_protein)
Get csv file with sequences according to given criteria:
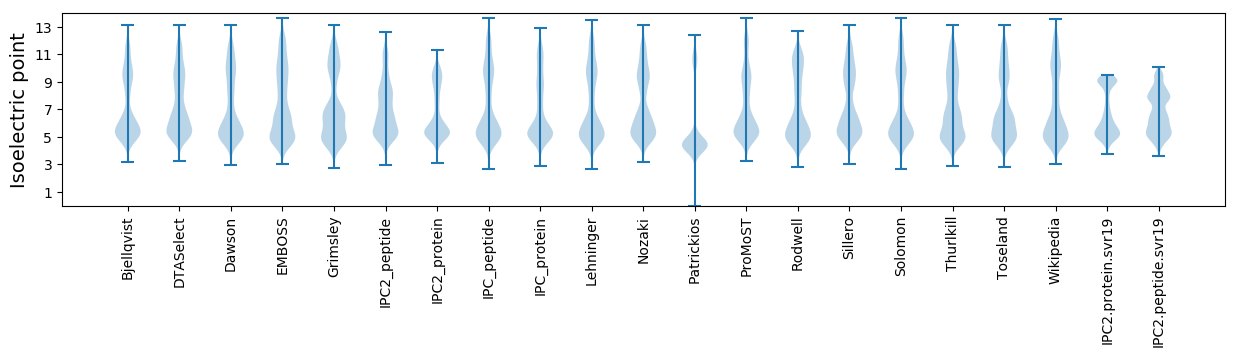
* You can choose from 21 different methods for calculating isoelectric point
Summary statistics related to proteome-wise predictions
Protein with the lowest isoelectric point:
>tr|A0A132MUB5|A0A132MUB5_9ACTN Allantoate amidohydrolase OS=Streptomyces thermoautotrophicus OX=1469144 GN=LI90_2527 PE=3 SV=1
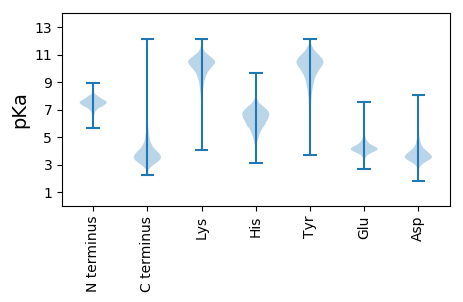
MM1 pKa = 7.97AEE3 pKa = 4.24PLKK6 pKa = 11.11VWIDD10 pKa = 3.58QNLCTGDD17 pKa = 3.96GLCAQYY23 pKa = 11.26APDD26 pKa = 4.19VFEE29 pKa = 6.18LDD31 pKa = 3.22IDD33 pKa = 3.59GLAYY37 pKa = 10.73VKK39 pKa = 10.94GPDD42 pKa = 3.4GEE44 pKa = 5.34LRR46 pKa = 11.84QQHH49 pKa = 6.23CASVPVPPDD58 pKa = 3.06LVLNVIDD65 pKa = 4.75SAKK68 pKa = 9.65EE69 pKa = 3.86CPGEE73 pKa = 4.35CIHH76 pKa = 6.8VVRR79 pKa = 11.84EE80 pKa = 3.9PDD82 pKa = 3.38GVEE85 pKa = 3.37IAGPNAEE92 pKa = 4.24EE93 pKa = 3.98
MM1 pKa = 7.97AEE3 pKa = 4.24PLKK6 pKa = 11.11VWIDD10 pKa = 3.58QNLCTGDD17 pKa = 3.96GLCAQYY23 pKa = 11.26APDD26 pKa = 4.19VFEE29 pKa = 6.18LDD31 pKa = 3.22IDD33 pKa = 3.59GLAYY37 pKa = 10.73VKK39 pKa = 10.94GPDD42 pKa = 3.4GEE44 pKa = 5.34LRR46 pKa = 11.84QQHH49 pKa = 6.23CASVPVPPDD58 pKa = 3.06LVLNVIDD65 pKa = 4.75SAKK68 pKa = 9.65EE69 pKa = 3.86CPGEE73 pKa = 4.35CIHH76 pKa = 6.8VVRR79 pKa = 11.84EE80 pKa = 3.9PDD82 pKa = 3.38GVEE85 pKa = 3.37IAGPNAEE92 pKa = 4.24EE93 pKa = 3.98
Molecular weight: 9.99 kDa
Isoelectric point according different methods:
Protein with the highest isoelectric point:
>tr|A0A132MLI5|A0A132MLI5_9ACTN Uncharacterized protein OS=Streptomyces thermoautotrophicus OX=1469144 GN=LI90_270 PE=4 SV=1
MM1 pKa = 7.69SKK3 pKa = 9.0RR4 pKa = 11.84TFQPNNRR11 pKa = 11.84RR12 pKa = 11.84RR13 pKa = 11.84AKK15 pKa = 8.28THH17 pKa = 5.07GFRR20 pKa = 11.84VRR22 pKa = 11.84MRR24 pKa = 11.84TRR26 pKa = 11.84AGRR29 pKa = 11.84AILAARR35 pKa = 11.84RR36 pKa = 11.84RR37 pKa = 11.84KK38 pKa = 9.35GRR40 pKa = 11.84QRR42 pKa = 11.84LSAA45 pKa = 4.04
MM1 pKa = 7.69SKK3 pKa = 9.0RR4 pKa = 11.84TFQPNNRR11 pKa = 11.84RR12 pKa = 11.84RR13 pKa = 11.84AKK15 pKa = 8.28THH17 pKa = 5.07GFRR20 pKa = 11.84VRR22 pKa = 11.84MRR24 pKa = 11.84TRR26 pKa = 11.84AGRR29 pKa = 11.84AILAARR35 pKa = 11.84RR36 pKa = 11.84RR37 pKa = 11.84KK38 pKa = 9.35GRR40 pKa = 11.84QRR42 pKa = 11.84LSAA45 pKa = 4.04
Molecular weight: 5.38 kDa
Isoelectric point according different methods:
Peptides (in silico digests for buttom-up proteomics)
Below you can find in silico digests of the whole proteome with Trypsin, Chymotrypsin, Trypsin+LysC, LysN, ArgC proteases suitable for different mass spec machines.| Try ESI |
 |
|---|
| ChTry ESI |
|
|---|
| ArgC ESI |
|
|---|
| LysN ESI |
|
|---|
| TryLysC ESI |
|
|---|
| Try MALDI |
|
|---|
| ChTry MALDI |
|
|---|
| ArgC MALDI |
|
|---|
| LysN MALDI |
|
|---|
| TryLysC MALDI |
|
|---|
| Try LTQ |
|
|---|
| ChTry LTQ |
|
|---|
| ArgC LTQ |
|
|---|
| LysN LTQ |
|
|---|
| TryLysC LTQ |
|
|---|
| Try MSlow |
|
|---|
| ChTry MSlow |
|
|---|
| ArgC MSlow |
|
|---|
| LysN MSlow |
|
|---|
| TryLysC MSlow |
|
|---|
| Try MShigh |
|
|---|
| ChTry MShigh |
|
|---|
| ArgC MShigh |
|
|---|
| LysN MShigh |
|
|---|
| TryLysC MShigh |
|
|---|
General Statistics
Number of major isoforms |
Number of additional isoforms |
Number of all proteins |
Number of amino acids |
Min. Seq. Length |
Max. Seq. Length |
Avg. Seq. Length |
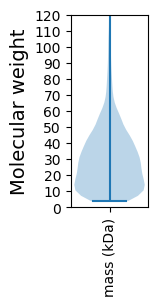
Avg. Mol. Weight |
|---|---|---|---|---|---|---|---|
0 |
1278468 |
37 |
3137 |
293.5 |
31.82 |
Amino acid frequency
Ala |
Cys |
Asp |
Glu |
Phe |
Gly |
His |
Ile |
Lys |
Leu |
|---|---|---|---|---|---|---|---|---|---|
13.134 ± 0.057 | 0.914 ± 0.011 |
5.665 ± 0.03 | 6.267 ± 0.036 |
2.736 ± 0.022 | 8.808 ± 0.035 |
2.243 ± 0.018 | 3.496 ± 0.026 |
2.173 ± 0.03 | 10.566 ± 0.049 |
Met |
Asn |
Gln |
Pro |
Arg |
Ser |
Thr |
Val |
Trp |
Tyr |
|---|---|---|---|---|---|---|---|---|---|
1.669 ± 0.016 | 1.733 ± 0.019 |
6.219 ± 0.039 | 2.969 ± 0.022 |
9.025 ± 0.049 | 4.3 ± 0.019 |
5.452 ± 0.025 | 8.861 ± 0.034 |
1.539 ± 0.017 | 2.23 ± 0.018 |
Most of the basic statistics you can see at this page can be downloaded from this CSV file
See this proteome in:

Proteome-pI is available under Creative Commons Attribution-NoDerivs license, for more details see here
| Reference: Kozlowski LP. Proteome-pI 2.0: Proteome Isoelectric Point Database Update. Nucleic Acids Res. 2021, doi: 10.1093/nar/gkab944 | Contact: Lukasz P. Kozlowski |