Streptococcus phage Javan1
Taxonomy: Viruses; Duplodnaviria; Heunggongvirae; Uroviricota; Caudoviricetes; Caudovirales; Siphoviridae; unclassified Siphoviridae
Average proteome isoelectric point is 6.2
Get precalculated fractions of proteins
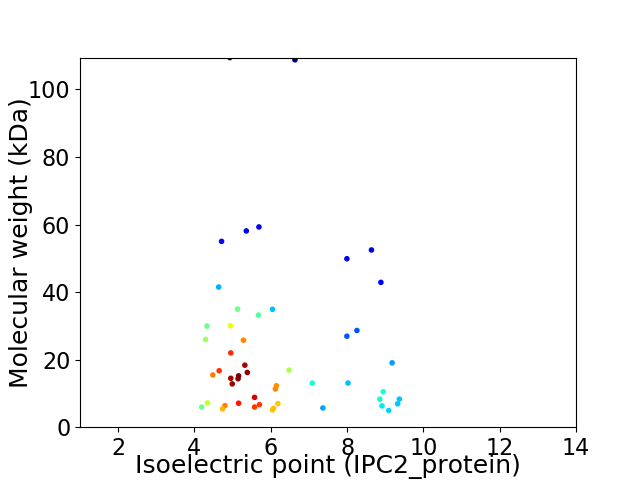
Virtual 2D-PAGE plot for 51 proteins (isoelectric point calculated using IPC2_protein)
Get csv file with sequences according to given criteria:
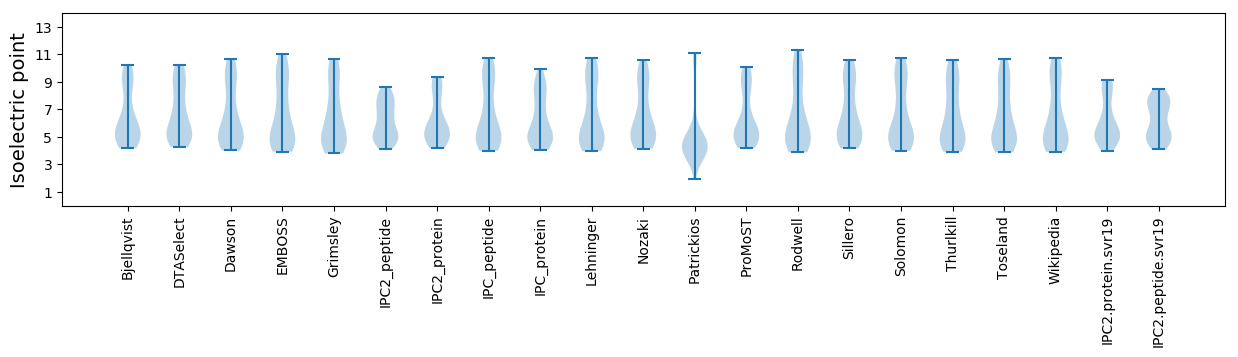
* You can choose from 21 different methods for calculating isoelectric point
Summary statistics related to proteome-wise predictions
Protein with the lowest isoelectric point:
>tr|A0A4D6A201|A0A4D6A201_9CAUD Uncharacterized protein OS=Streptococcus phage Javan1 OX=2547971 GN=Javan1_0022 PE=4 SV=1
MM1 pKa = 6.96TQDD4 pKa = 3.62EE5 pKa = 5.71LIEE8 pKa = 4.07MMNSDD13 pKa = 3.6VAIGIKK19 pKa = 9.39EE20 pKa = 4.24WIQLRR25 pKa = 11.84DD26 pKa = 3.63HH27 pKa = 6.6YY28 pKa = 9.64LQCIMSFEE36 pKa = 3.79MGYY39 pKa = 9.49RR40 pKa = 11.84LSYY43 pKa = 7.67ITEE46 pKa = 4.0YY47 pKa = 11.43VKK49 pKa = 10.7FLEE52 pKa = 4.19DD53 pKa = 4.83HH54 pKa = 6.49FMEE57 pKa = 5.48DD58 pKa = 3.41LL59 pKa = 4.13
MM1 pKa = 6.96TQDD4 pKa = 3.62EE5 pKa = 5.71LIEE8 pKa = 4.07MMNSDD13 pKa = 3.6VAIGIKK19 pKa = 9.39EE20 pKa = 4.24WIQLRR25 pKa = 11.84DD26 pKa = 3.63HH27 pKa = 6.6YY28 pKa = 9.64LQCIMSFEE36 pKa = 3.79MGYY39 pKa = 9.49RR40 pKa = 11.84LSYY43 pKa = 7.67ITEE46 pKa = 4.0YY47 pKa = 11.43VKK49 pKa = 10.7FLEE52 pKa = 4.19DD53 pKa = 4.83HH54 pKa = 6.49FMEE57 pKa = 5.48DD58 pKa = 3.41LL59 pKa = 4.13
Molecular weight: 7.21 kDa
Isoelectric point according different methods:
Protein with the highest isoelectric point:
>tr|A0A4D5ZX83|A0A4D5ZX83_9CAUD Uncharacterized protein OS=Streptococcus phage Javan1 OX=2547971 GN=Javan1_0041 PE=4 SV=1
MM1 pKa = 6.15TTHH4 pKa = 6.25MKK6 pKa = 9.47SAVMFVAILLLTTLFLMVSAIQRR29 pKa = 11.84LQWQIDD35 pKa = 3.6GLRR38 pKa = 11.84QRR40 pKa = 11.84NEE42 pKa = 4.06VITQQLQEE50 pKa = 4.01LNRR53 pKa = 11.84YY54 pKa = 8.12VGYY57 pKa = 9.78PGGG60 pKa = 3.67
MM1 pKa = 6.15TTHH4 pKa = 6.25MKK6 pKa = 9.47SAVMFVAILLLTTLFLMVSAIQRR29 pKa = 11.84LQWQIDD35 pKa = 3.6GLRR38 pKa = 11.84QRR40 pKa = 11.84NEE42 pKa = 4.06VITQQLQEE50 pKa = 4.01LNRR53 pKa = 11.84YY54 pKa = 8.12VGYY57 pKa = 9.78PGGG60 pKa = 3.67
Molecular weight: 6.92 kDa
Isoelectric point according different methods:
Peptides (in silico digests for buttom-up proteomics)
Below you can find in silico digests of the whole proteome with Trypsin, Chymotrypsin, Trypsin+LysC, LysN, ArgC proteases suitable for different mass spec machines.| Try ESI |
 |
|---|
| ChTry ESI |
|
|---|
| ArgC ESI |
|
|---|
| LysN ESI |
|
|---|
| TryLysC ESI |
|
|---|
| Try MALDI |
|
|---|
| ChTry MALDI |
|
|---|
| ArgC MALDI |
|
|---|
| LysN MALDI |
|
|---|
| TryLysC MALDI |
|
|---|
| Try LTQ |
|
|---|
| ChTry LTQ |
|
|---|
| ArgC LTQ |
|
|---|
| LysN LTQ |
|
|---|
| TryLysC LTQ |
|
|---|
| Try MSlow |
|
|---|
| ChTry MSlow |
|
|---|
| ArgC MSlow |
|
|---|
| LysN MSlow |
|
|---|
| TryLysC MSlow |
|
|---|
| Try MShigh |
|
|---|
| ChTry MShigh |
|
|---|
| ArgC MShigh |
|
|---|
| LysN MShigh |
|
|---|
| TryLysC MShigh |
|
|---|
General Statistics
Number of major isoforms |
Number of additional isoforms |
Number of all proteins |
Number of amino acids |
Min. Seq. Length |
Max. Seq. Length |
Avg. Seq. Length |
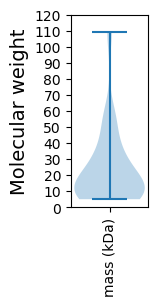
Avg. Mol. Weight |
|---|---|---|---|---|---|---|---|
0 |
10574 |
42 |
1023 |
207.3 |
23.55 |
Amino acid frequency
Ala |
Cys |
Asp |
Glu |
Phe |
Gly |
His |
Ile |
Lys |
Leu |
|---|---|---|---|---|---|---|---|---|---|
6.686 ± 0.483 | 0.492 ± 0.097 |
6.119 ± 0.2 | 8.445 ± 0.49 |
4.029 ± 0.211 | 6.081 ± 0.502 |
1.664 ± 0.191 | 7.197 ± 0.264 |
7.878 ± 0.368 | 8.682 ± 0.338 |
Met |
Asn |
Gln |
Pro |
Arg |
Ser |
Thr |
Val |
Trp |
Tyr |
|---|---|---|---|---|---|---|---|---|---|
2.241 ± 0.134 | 5.249 ± 0.258 |
2.78 ± 0.246 | 3.802 ± 0.228 |
4.899 ± 0.302 | 6.525 ± 0.291 |
5.731 ± 0.258 | 6.346 ± 0.288 |
0.955 ± 0.125 | 4.199 ± 0.368 |
Most of the basic statistics you can see at this page can be downloaded from this CSV file
See this proteome in:

Proteome-pI is available under Creative Commons Attribution-NoDerivs license, for more details see here
| Reference: Kozlowski LP. Proteome-pI 2.0: Proteome Isoelectric Point Database Update. Nucleic Acids Res. 2021, doi: 10.1093/nar/gkab944 | Contact: Lukasz P. Kozlowski |