Thauera sp. D20
Taxonomy: cellular organisms; Bacteria; Proteobacteria; Betaproteobacteria; Rhodocyclales; Zoogloeaceae; Thauera; unclassified Thauera
Average proteome isoelectric point is 6.5
Get precalculated fractions of proteins
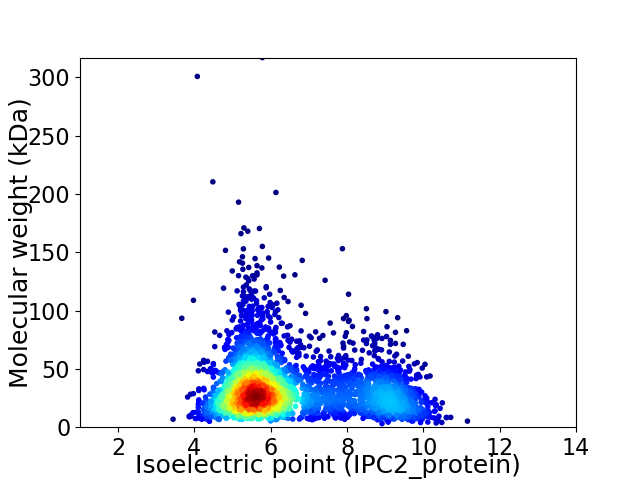
Virtual 2D-PAGE plot for 3318 proteins (isoelectric point calculated using IPC2_protein)
Get csv file with sequences according to given criteria:
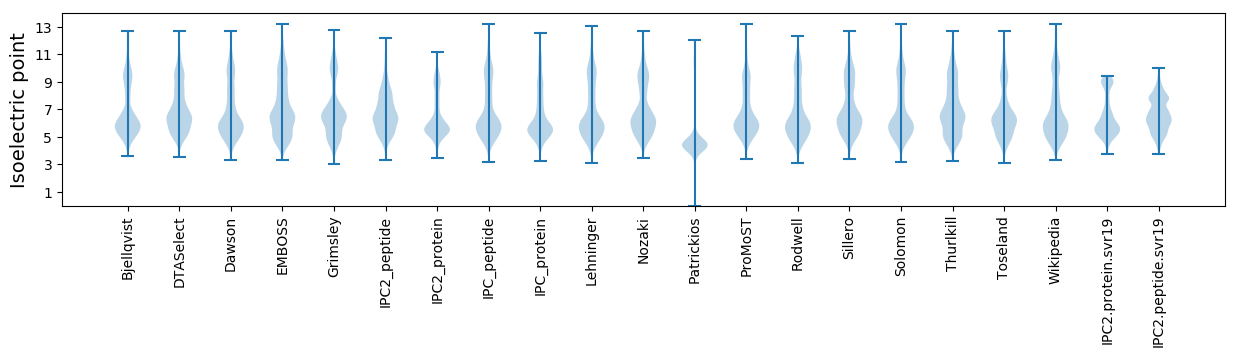
* You can choose from 21 different methods for calculating isoelectric point
Summary statistics related to proteome-wise predictions
Protein with the lowest isoelectric point:
>tr|A0A2T4IBB4|A0A2T4IBB4_9RHOO Alanine racemase OS=Thauera sp. D20 OX=2136175 GN=alr PE=3 SV=1
MM1 pKa = 7.03NAVVEE6 pKa = 4.54TPEE9 pKa = 3.94VLVFTDD15 pKa = 3.66SAANKK20 pKa = 8.85VRR22 pKa = 11.84EE23 pKa = 4.42LIEE26 pKa = 4.47EE27 pKa = 4.28EE28 pKa = 4.33GNPALKK34 pKa = 10.57LRR36 pKa = 11.84VFVTGGGCSGFQYY49 pKa = 10.93GFTFDD54 pKa = 5.12EE55 pKa = 4.54EE56 pKa = 4.44TADD59 pKa = 5.1DD60 pKa = 3.73DD61 pKa = 4.76TAFEE65 pKa = 4.65KK66 pKa = 11.2NGVTLLIDD74 pKa = 3.7PMSYY78 pKa = 10.31QYY80 pKa = 11.58LVGAEE85 pKa = 3.64IDD87 pKa = 3.75YY88 pKa = 10.77TEE90 pKa = 4.43GLEE93 pKa = 4.25GSQFVIRR100 pKa = 11.84NPNATSTCGCGSSFSAA116 pKa = 4.79
MM1 pKa = 7.03NAVVEE6 pKa = 4.54TPEE9 pKa = 3.94VLVFTDD15 pKa = 3.66SAANKK20 pKa = 8.85VRR22 pKa = 11.84EE23 pKa = 4.42LIEE26 pKa = 4.47EE27 pKa = 4.28EE28 pKa = 4.33GNPALKK34 pKa = 10.57LRR36 pKa = 11.84VFVTGGGCSGFQYY49 pKa = 10.93GFTFDD54 pKa = 5.12EE55 pKa = 4.54EE56 pKa = 4.44TADD59 pKa = 5.1DD60 pKa = 3.73DD61 pKa = 4.76TAFEE65 pKa = 4.65KK66 pKa = 11.2NGVTLLIDD74 pKa = 3.7PMSYY78 pKa = 10.31QYY80 pKa = 11.58LVGAEE85 pKa = 3.64IDD87 pKa = 3.75YY88 pKa = 10.77TEE90 pKa = 4.43GLEE93 pKa = 4.25GSQFVIRR100 pKa = 11.84NPNATSTCGCGSSFSAA116 pKa = 4.79
Molecular weight: 12.47 kDa
Isoelectric point according different methods:
Protein with the highest isoelectric point:
>tr|A0A2T4IIC3|A0A2T4IIC3_9RHOO MFS transporter OS=Thauera sp. D20 OX=2136175 GN=C8261_02240 PE=4 SV=1
MM1 pKa = 7.35KK2 pKa = 9.36RR3 pKa = 11.84TYY5 pKa = 9.97QPSVVRR11 pKa = 11.84RR12 pKa = 11.84KK13 pKa = 8.6RR14 pKa = 11.84THH16 pKa = 5.75GFLVRR21 pKa = 11.84MKK23 pKa = 9.7TRR25 pKa = 11.84GGRR28 pKa = 11.84AVIRR32 pKa = 11.84ARR34 pKa = 11.84RR35 pKa = 11.84AKK37 pKa = 9.91GRR39 pKa = 11.84HH40 pKa = 4.92RR41 pKa = 11.84LAVV44 pKa = 3.37
MM1 pKa = 7.35KK2 pKa = 9.36RR3 pKa = 11.84TYY5 pKa = 9.97QPSVVRR11 pKa = 11.84RR12 pKa = 11.84KK13 pKa = 8.6RR14 pKa = 11.84THH16 pKa = 5.75GFLVRR21 pKa = 11.84MKK23 pKa = 9.7TRR25 pKa = 11.84GGRR28 pKa = 11.84AVIRR32 pKa = 11.84ARR34 pKa = 11.84RR35 pKa = 11.84AKK37 pKa = 9.91GRR39 pKa = 11.84HH40 pKa = 4.92RR41 pKa = 11.84LAVV44 pKa = 3.37
Molecular weight: 5.22 kDa
Isoelectric point according different methods:
Peptides (in silico digests for buttom-up proteomics)
Below you can find in silico digests of the whole proteome with Trypsin, Chymotrypsin, Trypsin+LysC, LysN, ArgC proteases suitable for different mass spec machines.| Try ESI |
 |
|---|
| ChTry ESI |
|
|---|
| ArgC ESI |
|
|---|
| LysN ESI |
|
|---|
| TryLysC ESI |
|
|---|
| Try MALDI |
|
|---|
| ChTry MALDI |
|
|---|
| ArgC MALDI |
|
|---|
| LysN MALDI |
|
|---|
| TryLysC MALDI |
|
|---|
| Try LTQ |
|
|---|
| ChTry LTQ |
|
|---|
| ArgC LTQ |
|
|---|
| LysN LTQ |
|
|---|
| TryLysC LTQ |
|
|---|
| Try MSlow |
|
|---|
| ChTry MSlow |
|
|---|
| ArgC MSlow |
|
|---|
| LysN MSlow |
|
|---|
| TryLysC MSlow |
|
|---|
| Try MShigh |
|
|---|
| ChTry MShigh |
|
|---|
| ArgC MShigh |
|
|---|
| LysN MShigh |
|
|---|
| TryLysC MShigh |
|
|---|
General Statistics
Number of major isoforms |
Number of additional isoforms |
Number of all proteins |
Number of amino acids |
Min. Seq. Length |
Max. Seq. Length |
Avg. Seq. Length |
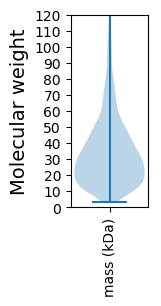
Avg. Mol. Weight |
|---|---|---|---|---|---|---|---|
0 |
1104624 |
26 |
2868 |
332.9 |
36.18 |
Amino acid frequency
Ala |
Cys |
Asp |
Glu |
Phe |
Gly |
His |
Ile |
Lys |
Leu |
|---|---|---|---|---|---|---|---|---|---|
13.635 ± 0.065 | 1.017 ± 0.017 |
5.484 ± 0.034 | 5.923 ± 0.042 |
3.496 ± 0.022 | 8.337 ± 0.041 |
2.436 ± 0.022 | 4.431 ± 0.031 |
2.471 ± 0.032 | 11.339 ± 0.057 |
Met |
Asn |
Gln |
Pro |
Arg |
Ser |
Thr |
Val |
Trp |
Tyr |
|---|---|---|---|---|---|---|---|---|---|
2.285 ± 0.021 | 2.37 ± 0.023 |
4.972 ± 0.033 | 3.468 ± 0.023 |
7.918 ± 0.042 | 4.853 ± 0.029 |
4.538 ± 0.026 | 7.479 ± 0.04 |
1.368 ± 0.019 | 2.179 ± 0.02 |
Most of the basic statistics you can see at this page can be downloaded from this CSV file
See this proteome in:

Proteome-pI is available under Creative Commons Attribution-NoDerivs license, for more details see here
| Reference: Kozlowski LP. Proteome-pI 2.0: Proteome Isoelectric Point Database Update. Nucleic Acids Res. 2021, doi: 10.1093/nar/gkab944 | Contact: Lukasz P. Kozlowski |