Xenorhabdus cabanillasii JM26
Taxonomy: cellular organisms; Bacteria; Proteobacteria; Gammaproteobacteria; Enterobacterales; Morganellaceae; Xenorhabdus; Xenorhabdus cabanillasii
Average proteome isoelectric point is 6.68
Get precalculated fractions of proteins
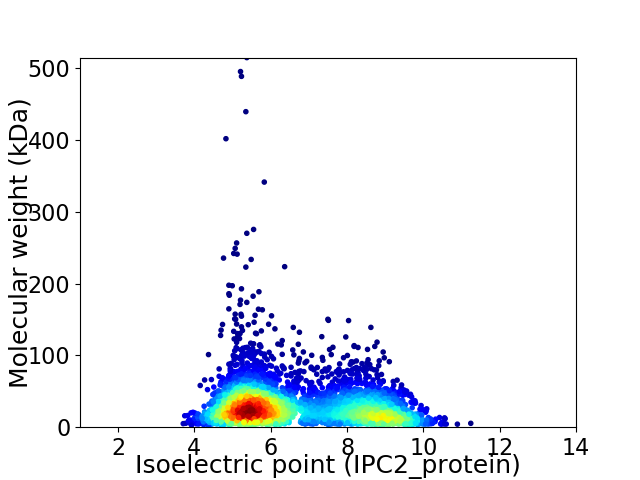
Virtual 2D-PAGE plot for 4375 proteins (isoelectric point calculated using IPC2_protein)
Get csv file with sequences according to given criteria:
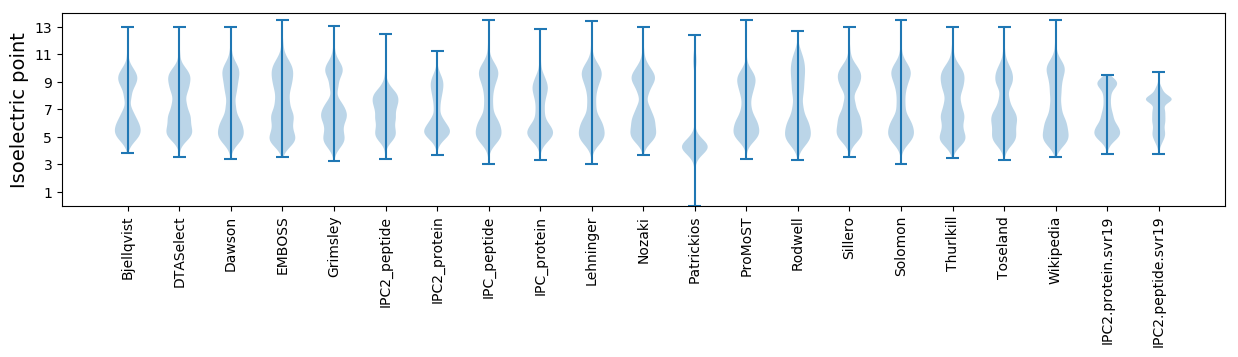
* You can choose from 21 different methods for calculating isoelectric point
Summary statistics related to proteome-wise predictions
Protein with the lowest isoelectric point:
>tr|W1IMQ8|W1IMQ8_9GAMM Major outer membrane lipoprotein Lpp OS=Xenorhabdus cabanillasii JM26 OX=1427517 GN=lpp PE=3 SV=1
MM1 pKa = 7.47KK2 pKa = 10.27NINYY6 pKa = 9.61SPLSIAQHH14 pKa = 5.72NDD16 pKa = 2.74GYY18 pKa = 10.54IIKK21 pKa = 9.85QVSDD25 pKa = 3.0SWSVEE30 pKa = 3.3FDD32 pKa = 3.4FDD34 pKa = 4.31IMILQRR40 pKa = 11.84CDD42 pKa = 3.22VYY44 pKa = 10.88IDD46 pKa = 4.36SGDD49 pKa = 3.74DD50 pKa = 3.27PALL53 pKa = 4.01
MM1 pKa = 7.47KK2 pKa = 10.27NINYY6 pKa = 9.61SPLSIAQHH14 pKa = 5.72NDD16 pKa = 2.74GYY18 pKa = 10.54IIKK21 pKa = 9.85QVSDD25 pKa = 3.0SWSVEE30 pKa = 3.3FDD32 pKa = 3.4FDD34 pKa = 4.31IMILQRR40 pKa = 11.84CDD42 pKa = 3.22VYY44 pKa = 10.88IDD46 pKa = 4.36SGDD49 pKa = 3.74DD50 pKa = 3.27PALL53 pKa = 4.01
Molecular weight: 6.08 kDa
Isoelectric point according different methods:
Protein with the highest isoelectric point:
>tr|W1JAX3|W1JAX3_9GAMM Uncharacterized lipoprotein YifL OS=Xenorhabdus cabanillasii JM26 OX=1427517 GN=XCR1_4300009 PE=4 SV=1
MM1 pKa = 7.45KK2 pKa = 9.51RR3 pKa = 11.84TFQPSVLKK11 pKa = 10.68RR12 pKa = 11.84NRR14 pKa = 11.84THH16 pKa = 7.28GFRR19 pKa = 11.84ARR21 pKa = 11.84MATKK25 pKa = 10.4NGRR28 pKa = 11.84QVLARR33 pKa = 11.84RR34 pKa = 11.84RR35 pKa = 11.84AKK37 pKa = 10.22GRR39 pKa = 11.84ARR41 pKa = 11.84LTVSKK46 pKa = 10.99
MM1 pKa = 7.45KK2 pKa = 9.51RR3 pKa = 11.84TFQPSVLKK11 pKa = 10.68RR12 pKa = 11.84NRR14 pKa = 11.84THH16 pKa = 7.28GFRR19 pKa = 11.84ARR21 pKa = 11.84MATKK25 pKa = 10.4NGRR28 pKa = 11.84QVLARR33 pKa = 11.84RR34 pKa = 11.84RR35 pKa = 11.84AKK37 pKa = 10.22GRR39 pKa = 11.84ARR41 pKa = 11.84LTVSKK46 pKa = 10.99
Molecular weight: 5.39 kDa
Isoelectric point according different methods:
Peptides (in silico digests for buttom-up proteomics)
Below you can find in silico digests of the whole proteome with Trypsin, Chymotrypsin, Trypsin+LysC, LysN, ArgC proteases suitable for different mass spec machines.| Try ESI |
 |
|---|
| ChTry ESI |
|
|---|
| ArgC ESI |
|
|---|
| LysN ESI |
|
|---|
| TryLysC ESI |
|
|---|
| Try MALDI |
|
|---|
| ChTry MALDI |
|
|---|
| ArgC MALDI |
|
|---|
| LysN MALDI |
|
|---|
| TryLysC MALDI |
|
|---|
| Try LTQ |
|
|---|
| ChTry LTQ |
|
|---|
| ArgC LTQ |
|
|---|
| LysN LTQ |
|
|---|
| TryLysC LTQ |
|
|---|
| Try MSlow |
|
|---|
| ChTry MSlow |
|
|---|
| ArgC MSlow |
|
|---|
| LysN MSlow |
|
|---|
| TryLysC MSlow |
|
|---|
| Try MShigh |
|
|---|
| ChTry MShigh |
|
|---|
| ArgC MShigh |
|
|---|
| LysN MShigh |
|
|---|
| TryLysC MShigh |
|
|---|
General Statistics
Number of major isoforms |
Number of additional isoforms |
Number of all proteins |
Number of amino acids |
Min. Seq. Length |
Max. Seq. Length |
Avg. Seq. Length |
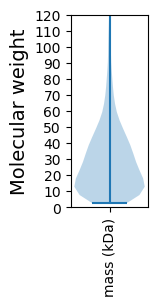
Avg. Mol. Weight |
|---|---|---|---|---|---|---|---|
0 |
1251180 |
20 |
4657 |
286.0 |
31.97 |
Amino acid frequency
Ala |
Cys |
Asp |
Glu |
Phe |
Gly |
His |
Ile |
Lys |
Leu |
|---|---|---|---|---|---|---|---|---|---|
8.081 ± 0.045 | 1.109 ± 0.015 |
5.187 ± 0.032 | 6.046 ± 0.034 |
3.955 ± 0.025 | 6.831 ± 0.04 |
2.343 ± 0.021 | 6.895 ± 0.041 |
5.257 ± 0.039 | 10.436 ± 0.045 |
Met |
Asn |
Gln |
Pro |
Arg |
Ser |
Thr |
Val |
Trp |
Tyr |
|---|---|---|---|---|---|---|---|---|---|
2.551 ± 0.018 | 4.529 ± 0.035 |
4.196 ± 0.03 | 4.671 ± 0.04 |
5.223 ± 0.033 | 6.416 ± 0.029 |
5.366 ± 0.03 | 6.354 ± 0.028 |
1.336 ± 0.015 | 3.216 ± 0.025 |
Most of the basic statistics you can see at this page can be downloaded from this CSV file
See this proteome in:

Proteome-pI is available under Creative Commons Attribution-NoDerivs license, for more details see here
| Reference: Kozlowski LP. Proteome-pI 2.0: Proteome Isoelectric Point Database Update. Nucleic Acids Res. 2021, doi: 10.1093/nar/gkab944 | Contact: Lukasz P. Kozlowski |