Microbacterium phage GaeCeo
Taxonomy: Viruses; Duplodnaviria; Heunggongvirae; Uroviricota; Caudoviricetes; Caudovirales; Siphoviridae; Schubertvirus; unclassified Schubertvirus
Average proteome isoelectric point is 6.15
Get precalculated fractions of proteins
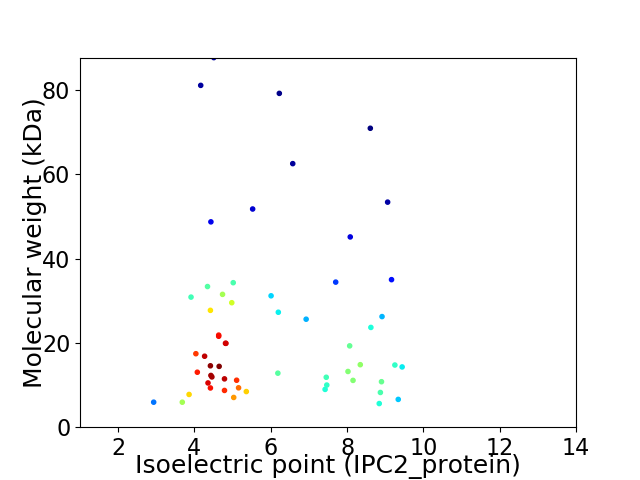
Virtual 2D-PAGE plot for 58 proteins (isoelectric point calculated using IPC2_protein)
Get csv file with sequences according to given criteria:
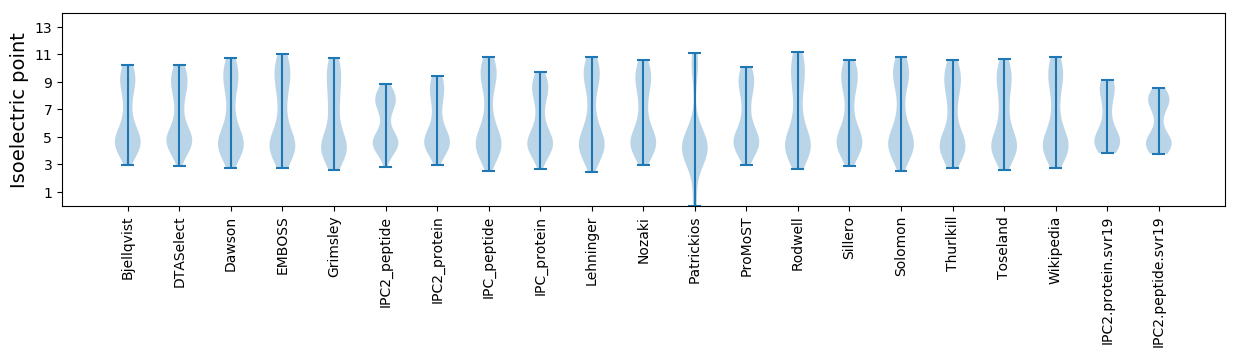
* You can choose from 21 different methods for calculating isoelectric point
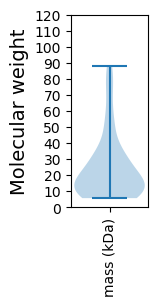
Summary statistics related to proteome-wise predictions
Protein with the lowest isoelectric point:
>tr|A0A7G9A319|A0A7G9A319_9CAUD DUF2786 domain-containing protein OS=Microbacterium phage GaeCeo OX=2759461 GN=55 PE=4 SV=1
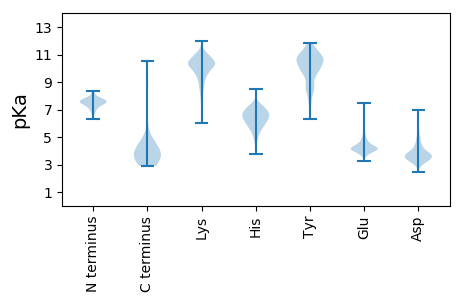
MM1 pKa = 7.51EE2 pKa = 5.12NNYY5 pKa = 8.3PTFQEE10 pKa = 3.88VRR12 pKa = 11.84NYY14 pKa = 10.92LIDD17 pKa = 4.91DD18 pKa = 4.21NDD20 pKa = 3.8WTDD23 pKa = 3.52EE24 pKa = 4.34EE25 pKa = 4.58VDD27 pKa = 3.58QLAGYY32 pKa = 9.83AFRR35 pKa = 11.84HH36 pKa = 5.65INQDD40 pKa = 2.44GTTTMTRR47 pKa = 11.84DD48 pKa = 2.59QWTCYY53 pKa = 10.12IMDD56 pKa = 3.99YY57 pKa = 10.69CNEE60 pKa = 4.55HH61 pKa = 6.81IDD63 pKa = 3.8LL64 pKa = 4.85
MM1 pKa = 7.51EE2 pKa = 5.12NNYY5 pKa = 8.3PTFQEE10 pKa = 3.88VRR12 pKa = 11.84NYY14 pKa = 10.92LIDD17 pKa = 4.91DD18 pKa = 4.21NDD20 pKa = 3.8WTDD23 pKa = 3.52EE24 pKa = 4.34EE25 pKa = 4.58VDD27 pKa = 3.58QLAGYY32 pKa = 9.83AFRR35 pKa = 11.84HH36 pKa = 5.65INQDD40 pKa = 2.44GTTTMTRR47 pKa = 11.84DD48 pKa = 2.59QWTCYY53 pKa = 10.12IMDD56 pKa = 3.99YY57 pKa = 10.69CNEE60 pKa = 4.55HH61 pKa = 6.81IDD63 pKa = 3.8LL64 pKa = 4.85
Molecular weight: 7.77 kDa
Isoelectric point according different methods:
Protein with the highest isoelectric point:
>tr|A0A7G9A2Y7|A0A7G9A2Y7_9CAUD Uncharacterized protein OS=Microbacterium phage GaeCeo OX=2759461 GN=22 PE=4 SV=1
MM1 pKa = 7.62AMRR4 pKa = 11.84RR5 pKa = 11.84AIVRR9 pKa = 11.84NPNSFKK15 pKa = 9.73QTLTIQVKK23 pKa = 7.7VTSAGGDD30 pKa = 3.37VKK32 pKa = 10.4ITDD35 pKa = 5.86LILQAGSTGTGWVPNVTEE53 pKa = 4.44MPWTAGVVSS62 pKa = 4.18
MM1 pKa = 7.62AMRR4 pKa = 11.84RR5 pKa = 11.84AIVRR9 pKa = 11.84NPNSFKK15 pKa = 9.73QTLTIQVKK23 pKa = 7.7VTSAGGDD30 pKa = 3.37VKK32 pKa = 10.4ITDD35 pKa = 5.86LILQAGSTGTGWVPNVTEE53 pKa = 4.44MPWTAGVVSS62 pKa = 4.18
Molecular weight: 6.6 kDa
Isoelectric point according different methods:
Peptides (in silico digests for buttom-up proteomics)
Below you can find in silico digests of the whole proteome with Trypsin, Chymotrypsin, Trypsin+LysC, LysN, ArgC proteases suitable for different mass spec machines.| Try ESI |
 |
|---|
| ChTry ESI |
|
|---|
| ArgC ESI |
|
|---|
| LysN ESI |
|
|---|
| TryLysC ESI |
|
|---|
| Try MALDI |
|
|---|
| ChTry MALDI |
|
|---|
| ArgC MALDI |
|
|---|
| LysN MALDI |
|
|---|
| TryLysC MALDI |
|
|---|
| Try LTQ |
|
|---|
| ChTry LTQ |
|
|---|
| ArgC LTQ |
|
|---|
| LysN LTQ |
|
|---|
| TryLysC LTQ |
|
|---|
| Try MSlow |
|
|---|
| ChTry MSlow |
|
|---|
| ArgC MSlow |
|
|---|
| LysN MSlow |
|
|---|
| TryLysC MSlow |
|
|---|
| Try MShigh |
|
|---|
| ChTry MShigh |
|
|---|
| ArgC MShigh |
|
|---|
| LysN MShigh |
|
|---|
| TryLysC MShigh |
|
|---|
General Statistics
Number of major isoforms |
Number of additional isoforms |
Number of all proteins |
Number of amino acids |
Min. Seq. Length |
Max. Seq. Length |
Avg. Seq. Length |
Avg. Mol. Weight |
|---|---|---|---|---|---|---|---|
0 |
12836 |
50 |
808 |
221.3 |
24.38 |
Amino acid frequency
Ala |
Cys |
Asp |
Glu |
Phe |
Gly |
His |
Ile |
Lys |
Leu |
|---|---|---|---|---|---|---|---|---|---|
10.058 ± 0.432 | 0.639 ± 0.093 |
6.614 ± 0.367 | 6.529 ± 0.475 |
3.077 ± 0.195 | 8.04 ± 0.401 |
1.893 ± 0.219 | 4.659 ± 0.437 |
4.908 ± 0.461 | 8.609 ± 0.368 |
Met |
Asn |
Gln |
Pro |
Arg |
Ser |
Thr |
Val |
Trp |
Tyr |
|---|---|---|---|---|---|---|---|---|---|
2.47 ± 0.131 | 3.373 ± 0.196 |
4.503 ± 0.224 | 3.965 ± 0.178 |
5.726 ± 0.398 | 5.905 ± 0.323 |
6.661 ± 0.325 | 7.495 ± 0.303 |
1.987 ± 0.251 | 2.89 ± 0.227 |
Most of the basic statistics you can see at this page can be downloaded from this CSV file
See this proteome in:

Proteome-pI is available under Creative Commons Attribution-NoDerivs license, for more details see here
| Reference: Kozlowski LP. Proteome-pI 2.0: Proteome Isoelectric Point Database Update. Nucleic Acids Res. 2021, doi: 10.1093/nar/gkab944 | Contact: Lukasz P. Kozlowski |