Streptococcus satellite phage Javan732
Taxonomy: Viruses; unclassified bacterial viruses
Average proteome isoelectric point is 6.19
Get precalculated fractions of proteins
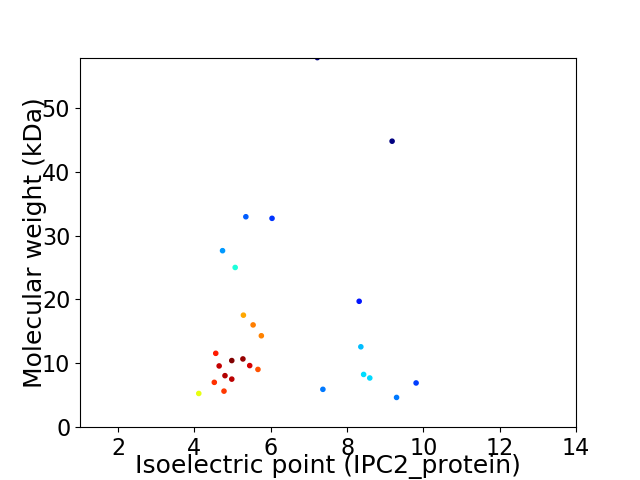
Virtual 2D-PAGE plot for 27 proteins (isoelectric point calculated using IPC2_protein)
Get csv file with sequences according to given criteria:
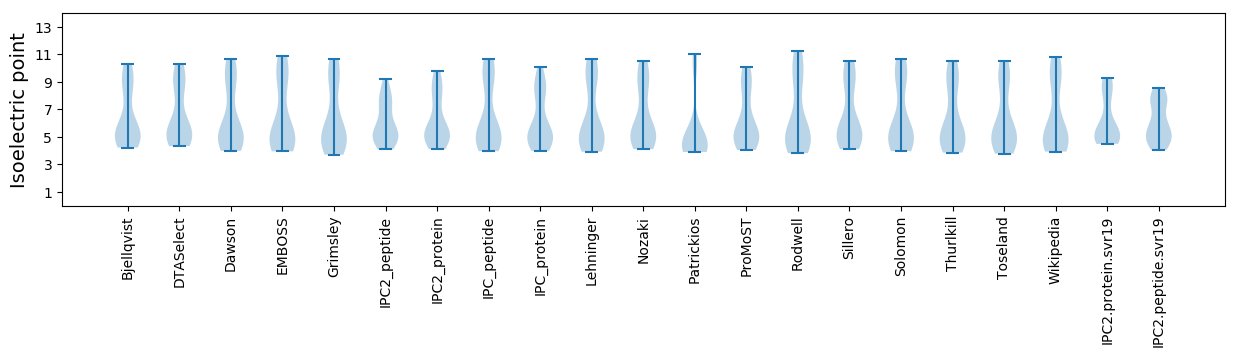
* You can choose from 21 different methods for calculating isoelectric point
Summary statistics related to proteome-wise predictions
Protein with the lowest isoelectric point:
>tr|A0A4D5ZV78|A0A4D5ZV78_9VIRU Uncharacterized protein OS=Streptococcus satellite phage Javan732 OX=2558826 GN=JavanS732_0009 PE=4 SV=1
MM1 pKa = 7.22TLDD4 pKa = 4.01LGKK7 pKa = 8.39MTQAEE12 pKa = 4.45FDD14 pKa = 3.72EE15 pKa = 4.66VMADD19 pKa = 3.21IKK21 pKa = 11.13ARR23 pKa = 11.84NPNLLQLITDD33 pKa = 4.52FLDD36 pKa = 3.62RR37 pKa = 11.84KK38 pKa = 8.24VTPEE42 pKa = 4.05EE43 pKa = 3.86VDD45 pKa = 3.54DD46 pKa = 4.24
MM1 pKa = 7.22TLDD4 pKa = 4.01LGKK7 pKa = 8.39MTQAEE12 pKa = 4.45FDD14 pKa = 3.72EE15 pKa = 4.66VMADD19 pKa = 3.21IKK21 pKa = 11.13ARR23 pKa = 11.84NPNLLQLITDD33 pKa = 4.52FLDD36 pKa = 3.62RR37 pKa = 11.84KK38 pKa = 8.24VTPEE42 pKa = 4.05EE43 pKa = 3.86VDD45 pKa = 3.54DD46 pKa = 4.24
Molecular weight: 5.28 kDa
Isoelectric point according different methods:
Protein with the highest isoelectric point:
>tr|A0A4D5ZUW3|A0A4D5ZUW3_9VIRU Uncharacterized protein OS=Streptococcus satellite phage Javan732 OX=2558826 GN=JavanS732_0007 PE=4 SV=1
MM1 pKa = 7.27QKK3 pKa = 10.12RR4 pKa = 11.84GKK6 pKa = 9.97LKK8 pKa = 10.04NRR10 pKa = 11.84KK11 pKa = 8.65PIYY14 pKa = 9.15RR15 pKa = 11.84LKK17 pKa = 10.79RR18 pKa = 11.84KK19 pKa = 9.53IGQKK23 pKa = 9.55CNKK26 pKa = 9.51HH27 pKa = 5.42EE28 pKa = 3.89AHH30 pKa = 6.95CYY32 pKa = 8.84YY33 pKa = 10.66FSFRR37 pKa = 11.84AAEE40 pKa = 4.06SAEE43 pKa = 3.82NATYY47 pKa = 10.46SIPTRR52 pKa = 11.84HH53 pKa = 6.78NIQQSS58 pKa = 3.12
MM1 pKa = 7.27QKK3 pKa = 10.12RR4 pKa = 11.84GKK6 pKa = 9.97LKK8 pKa = 10.04NRR10 pKa = 11.84KK11 pKa = 8.65PIYY14 pKa = 9.15RR15 pKa = 11.84LKK17 pKa = 10.79RR18 pKa = 11.84KK19 pKa = 9.53IGQKK23 pKa = 9.55CNKK26 pKa = 9.51HH27 pKa = 5.42EE28 pKa = 3.89AHH30 pKa = 6.95CYY32 pKa = 8.84YY33 pKa = 10.66FSFRR37 pKa = 11.84AAEE40 pKa = 4.06SAEE43 pKa = 3.82NATYY47 pKa = 10.46SIPTRR52 pKa = 11.84HH53 pKa = 6.78NIQQSS58 pKa = 3.12
Molecular weight: 6.93 kDa
Isoelectric point according different methods:
Peptides (in silico digests for buttom-up proteomics)
Below you can find in silico digests of the whole proteome with Trypsin, Chymotrypsin, Trypsin+LysC, LysN, ArgC proteases suitable for different mass spec machines.| Try ESI |
 |
|---|
| ChTry ESI |
|
|---|
| ArgC ESI |
|
|---|
| LysN ESI |
|
|---|
| TryLysC ESI |
|
|---|
| Try MALDI |
|
|---|
| ChTry MALDI |
|
|---|
| ArgC MALDI |
|
|---|
| LysN MALDI |
|
|---|
| TryLysC MALDI |
|
|---|
| Try LTQ |
|
|---|
| ChTry LTQ |
|
|---|
| ArgC LTQ |
|
|---|
| LysN LTQ |
|
|---|
| TryLysC LTQ |
|
|---|
| Try MSlow |
|
|---|
| ChTry MSlow |
|
|---|
| ArgC MSlow |
|
|---|
| LysN MSlow |
|
|---|
| TryLysC MSlow |
|
|---|
| Try MShigh |
|
|---|
| ChTry MShigh |
|
|---|
| ArgC MShigh |
|
|---|
| LysN MShigh |
|
|---|
| TryLysC MShigh |
|
|---|
General Statistics
Number of major isoforms |
Number of additional isoforms |
Number of all proteins |
Number of amino acids |
Min. Seq. Length |
Max. Seq. Length |
Avg. Seq. Length |
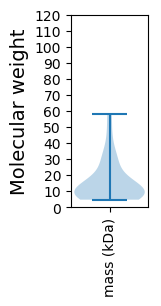
Avg. Mol. Weight |
|---|---|---|---|---|---|---|---|
0 |
3710 |
38 |
496 |
137.4 |
15.89 |
Amino acid frequency
Ala |
Cys |
Asp |
Glu |
Phe |
Gly |
His |
Ile |
Lys |
Leu |
|---|---|---|---|---|---|---|---|---|---|
5.66 ± 0.416 | 0.755 ± 0.135 |
5.768 ± 0.396 | 9.623 ± 0.691 |
4.124 ± 0.318 | 4.798 ± 0.301 |
1.429 ± 0.256 | 7.035 ± 0.362 |
9.191 ± 0.511 | 10.081 ± 0.378 |
Met |
Asn |
Gln |
Pro |
Arg |
Ser |
Thr |
Val |
Trp |
Tyr |
|---|---|---|---|---|---|---|---|---|---|
2.642 ± 0.216 | 5.58 ± 0.385 |
2.965 ± 0.37 | 3.935 ± 0.291 |
5.499 ± 0.223 | 5.418 ± 0.348 |
5.472 ± 0.458 | 5.283 ± 0.457 |
0.782 ± 0.208 | 3.962 ± 0.291 |
Most of the basic statistics you can see at this page can be downloaded from this CSV file
See this proteome in:

Proteome-pI is available under Creative Commons Attribution-NoDerivs license, for more details see here
| Reference: Kozlowski LP. Proteome-pI 2.0: Proteome Isoelectric Point Database Update. Nucleic Acids Res. 2021, doi: 10.1093/nar/gkab944 | Contact: Lukasz P. Kozlowski |