Streptococcus satellite phage Javan753
Taxonomy: Viruses; unclassified bacterial viruses
Average proteome isoelectric point is 6.51
Get precalculated fractions of proteins
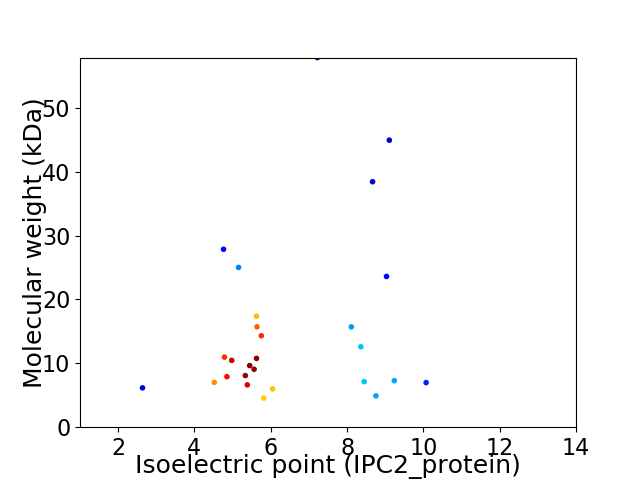
Virtual 2D-PAGE plot for 27 proteins (isoelectric point calculated using IPC2_protein)
Get csv file with sequences according to given criteria:
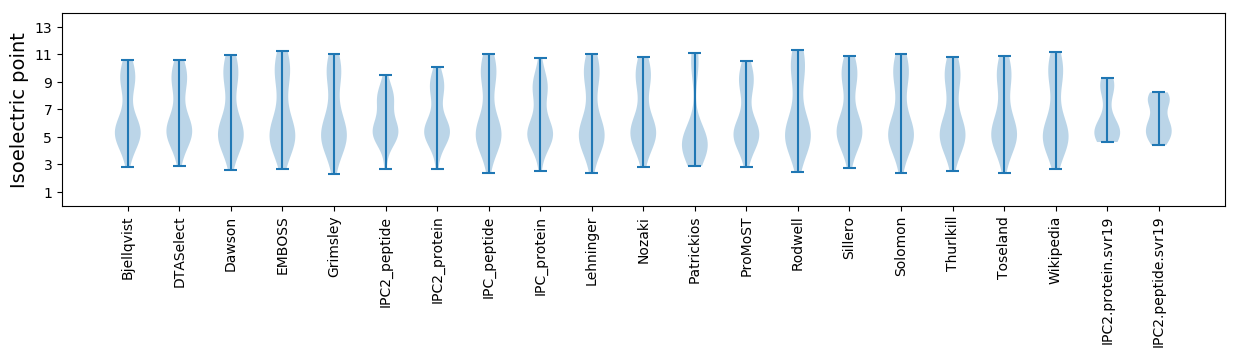
* You can choose from 21 different methods for calculating isoelectric point
Summary statistics related to proteome-wise predictions
Protein with the lowest isoelectric point:
>tr|A0A4D5ZY76|A0A4D5ZY76_9VIRU Uncharacterized protein OS=Streptococcus satellite phage Javan753 OX=2558848 GN=JavanS753_0016 PE=4 SV=1
MM1 pKa = 7.25NFKK4 pKa = 10.19EE5 pKa = 4.41FKK7 pKa = 9.26TWLDD11 pKa = 3.62DD12 pKa = 3.87AVSMAEE18 pKa = 4.78AMALPEE24 pKa = 4.11NTGVLDD30 pKa = 4.91DD31 pKa = 5.52LIEE34 pKa = 4.26NAANNLAFIAEE45 pKa = 4.28LVEE48 pKa = 3.7NRR50 pKa = 11.84QLIYY54 pKa = 10.4RR55 pKa = 11.84KK56 pKa = 9.18PRR58 pKa = 11.84HH59 pKa = 5.79EE60 pKa = 4.27DD61 pKa = 2.83
MM1 pKa = 7.25NFKK4 pKa = 10.19EE5 pKa = 4.41FKK7 pKa = 9.26TWLDD11 pKa = 3.62DD12 pKa = 3.87AVSMAEE18 pKa = 4.78AMALPEE24 pKa = 4.11NTGVLDD30 pKa = 4.91DD31 pKa = 5.52LIEE34 pKa = 4.26NAANNLAFIAEE45 pKa = 4.28LVEE48 pKa = 3.7NRR50 pKa = 11.84QLIYY54 pKa = 10.4RR55 pKa = 11.84KK56 pKa = 9.18PRR58 pKa = 11.84HH59 pKa = 5.79EE60 pKa = 4.27DD61 pKa = 2.83
Molecular weight: 7.02 kDa
Isoelectric point according different methods:
Protein with the highest isoelectric point:
>tr|A0A4D5ZVT7|A0A4D5ZVT7_9VIRU Uncharacterized protein OS=Streptococcus satellite phage Javan753 OX=2558848 GN=JavanS753_0024 PE=4 SV=1
MM1 pKa = 7.27QKK3 pKa = 10.12RR4 pKa = 11.84GKK6 pKa = 9.97LKK8 pKa = 10.04NRR10 pKa = 11.84KK11 pKa = 8.65PIYY14 pKa = 9.15RR15 pKa = 11.84LKK17 pKa = 10.79RR18 pKa = 11.84KK19 pKa = 9.53IGQKK23 pKa = 9.55CNKK26 pKa = 9.35HH27 pKa = 4.63EE28 pKa = 3.71AHH30 pKa = 7.15RR31 pKa = 11.84YY32 pKa = 7.45YY33 pKa = 10.88FSFRR37 pKa = 11.84AAEE40 pKa = 4.06SAEE43 pKa = 3.82NATYY47 pKa = 10.46SIPTRR52 pKa = 11.84HH53 pKa = 6.78NIQQSS58 pKa = 3.12
MM1 pKa = 7.27QKK3 pKa = 10.12RR4 pKa = 11.84GKK6 pKa = 9.97LKK8 pKa = 10.04NRR10 pKa = 11.84KK11 pKa = 8.65PIYY14 pKa = 9.15RR15 pKa = 11.84LKK17 pKa = 10.79RR18 pKa = 11.84KK19 pKa = 9.53IGQKK23 pKa = 9.55CNKK26 pKa = 9.35HH27 pKa = 4.63EE28 pKa = 3.71AHH30 pKa = 7.15RR31 pKa = 11.84YY32 pKa = 7.45YY33 pKa = 10.88FSFRR37 pKa = 11.84AAEE40 pKa = 4.06SAEE43 pKa = 3.82NATYY47 pKa = 10.46SIPTRR52 pKa = 11.84HH53 pKa = 6.78NIQQSS58 pKa = 3.12
Molecular weight: 6.98 kDa
Isoelectric point according different methods:
Peptides (in silico digests for buttom-up proteomics)
Below you can find in silico digests of the whole proteome with Trypsin, Chymotrypsin, Trypsin+LysC, LysN, ArgC proteases suitable for different mass spec machines.| Try ESI |
 |
|---|
| ChTry ESI |
|
|---|
| ArgC ESI |
|
|---|
| LysN ESI |
|
|---|
| TryLysC ESI |
|
|---|
| Try MALDI |
|
|---|
| ChTry MALDI |
|
|---|
| ArgC MALDI |
|
|---|
| LysN MALDI |
|
|---|
| TryLysC MALDI |
|
|---|
| Try LTQ |
|
|---|
| ChTry LTQ |
|
|---|
| ArgC LTQ |
|
|---|
| LysN LTQ |
|
|---|
| TryLysC LTQ |
|
|---|
| Try MSlow |
|
|---|
| ChTry MSlow |
|
|---|
| ArgC MSlow |
|
|---|
| LysN MSlow |
|
|---|
| TryLysC MSlow |
|
|---|
| Try MShigh |
|
|---|
| ChTry MShigh |
|
|---|
| ArgC MShigh |
|
|---|
| LysN MShigh |
|
|---|
| TryLysC MShigh |
|
|---|
General Statistics
Number of major isoforms |
Number of additional isoforms |
Number of all proteins |
Number of amino acids |
Min. Seq. Length |
Max. Seq. Length |
Avg. Seq. Length |
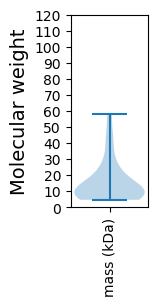
Avg. Mol. Weight |
|---|---|---|---|---|---|---|---|
0 |
3615 |
40 |
496 |
133.9 |
15.44 |
Amino acid frequency
Ala |
Cys |
Asp |
Glu |
Phe |
Gly |
His |
Ile |
Lys |
Leu |
|---|---|---|---|---|---|---|---|---|---|
5.781 ± 0.442 | 0.802 ± 0.164 |
5.754 ± 0.484 | 8.824 ± 0.851 |
4.011 ± 0.333 | 4.924 ± 0.498 |
1.411 ± 0.243 | 7.358 ± 0.361 |
9.35 ± 0.517 | 9.378 ± 0.478 |
Met |
Asn |
Gln |
Pro |
Arg |
Ser |
Thr |
Val |
Trp |
Tyr |
|---|---|---|---|---|---|---|---|---|---|
2.656 ± 0.331 | 5.477 ± 0.443 |
3.043 ± 0.376 | 3.9 ± 0.3 |
5.588 ± 0.434 | 5.726 ± 0.316 |
5.477 ± 0.533 | 5.671 ± 0.547 |
0.83 ± 0.218 | 4.039 ± 0.316 |
Most of the basic statistics you can see at this page can be downloaded from this CSV file
See this proteome in:

Proteome-pI is available under Creative Commons Attribution-NoDerivs license, for more details see here
| Reference: Kozlowski LP. Proteome-pI 2.0: Proteome Isoelectric Point Database Update. Nucleic Acids Res. 2021, doi: 10.1093/nar/gkab944 | Contact: Lukasz P. Kozlowski |