Freshwater phage uvFW-CGR-AMD-COM-C455
Taxonomy: Viruses; Duplodnaviria; Heunggongvirae; Uroviricota; Caudoviricetes; Caudovirales; Podoviridae; unclassified Podoviridae
Average proteome isoelectric point is 6.3
Get precalculated fractions of proteins
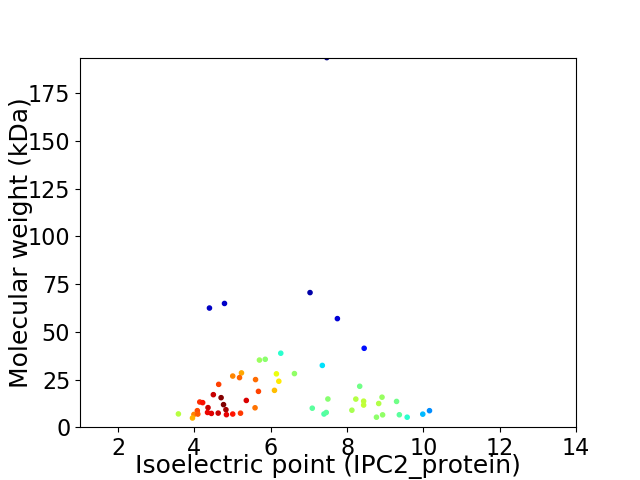
Virtual 2D-PAGE plot for 58 proteins (isoelectric point calculated using IPC2_protein)
Get csv file with sequences according to given criteria:
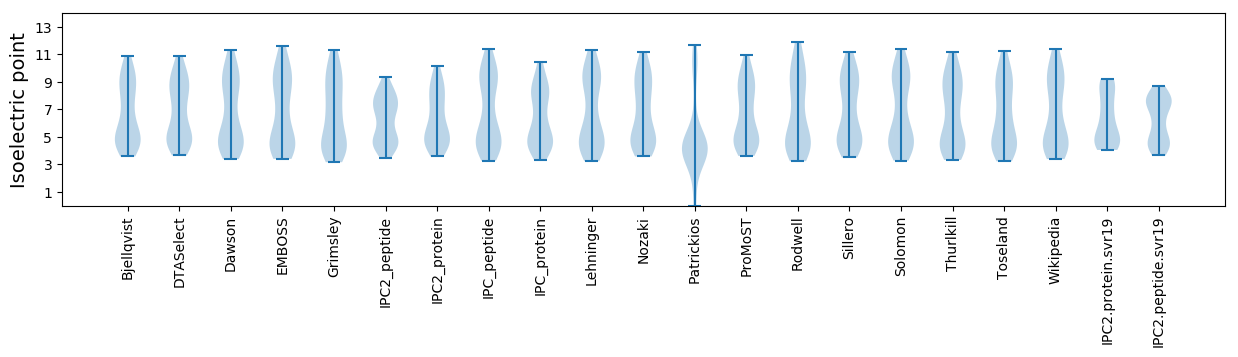
* You can choose from 21 different methods for calculating isoelectric point
Summary statistics related to proteome-wise predictions
Protein with the lowest isoelectric point:
>tr|A0A1B0XUE8|A0A1B0XUE8_9CAUD Uncharacterized protein OS=Freshwater phage uvFW-CGR-AMD-COM-C455 OX=1838156 GN=uvFWCGRAMDCOMC455_042 PE=4 SV=1
MM1 pKa = 7.67TEE3 pKa = 3.83TPDD6 pKa = 2.87WRR8 pKa = 11.84GIPTAACPTCGGVWFNVPVIFDD30 pKa = 3.81PEE32 pKa = 4.4TYY34 pKa = 10.31EE35 pKa = 3.75PAGWGTEE42 pKa = 4.11ATCFSCDD49 pKa = 3.48TLVTAPCPLDD59 pKa = 3.82LPNAILL65 pKa = 4.16
MM1 pKa = 7.67TEE3 pKa = 3.83TPDD6 pKa = 2.87WRR8 pKa = 11.84GIPTAACPTCGGVWFNVPVIFDD30 pKa = 3.81PEE32 pKa = 4.4TYY34 pKa = 10.31EE35 pKa = 3.75PAGWGTEE42 pKa = 4.11ATCFSCDD49 pKa = 3.48TLVTAPCPLDD59 pKa = 3.82LPNAILL65 pKa = 4.16
Molecular weight: 6.96 kDa
Isoelectric point according different methods:
Protein with the highest isoelectric point:
>tr|A0A1B0XUF8|A0A1B0XUF8_9CAUD Transcription factor WhiB OS=Freshwater phage uvFW-CGR-AMD-COM-C455 OX=1838156 GN=uvFWCGRAMDCOMC455_08 PE=4 SV=1
MM1 pKa = 8.16DD2 pKa = 6.24EE3 pKa = 4.08ILEE6 pKa = 4.16LEE8 pKa = 4.42IYY10 pKa = 10.66SNGWLDD16 pKa = 4.34FGLAGQLYY24 pKa = 10.6VGIDD28 pKa = 3.74LKK30 pKa = 11.36AVIVVVLAVATIKK43 pKa = 10.77FIAPRR48 pKa = 11.84IRR50 pKa = 11.84RR51 pKa = 11.84TRR53 pKa = 11.84SRR55 pKa = 11.84RR56 pKa = 11.84RR57 pKa = 3.21
MM1 pKa = 8.16DD2 pKa = 6.24EE3 pKa = 4.08ILEE6 pKa = 4.16LEE8 pKa = 4.42IYY10 pKa = 10.66SNGWLDD16 pKa = 4.34FGLAGQLYY24 pKa = 10.6VGIDD28 pKa = 3.74LKK30 pKa = 11.36AVIVVVLAVATIKK43 pKa = 10.77FIAPRR48 pKa = 11.84IRR50 pKa = 11.84RR51 pKa = 11.84TRR53 pKa = 11.84SRR55 pKa = 11.84RR56 pKa = 11.84RR57 pKa = 3.21
Molecular weight: 6.52 kDa
Isoelectric point according different methods:
Peptides (in silico digests for buttom-up proteomics)
Below you can find in silico digests of the whole proteome with Trypsin, Chymotrypsin, Trypsin+LysC, LysN, ArgC proteases suitable for different mass spec machines.| Try ESI |
 |
|---|
| ChTry ESI |
|
|---|
| ArgC ESI |
|
|---|
| LysN ESI |
|
|---|
| TryLysC ESI |
|
|---|
| Try MALDI |
|
|---|
| ChTry MALDI |
|
|---|
| ArgC MALDI |
|
|---|
| LysN MALDI |
|
|---|
| TryLysC MALDI |
|
|---|
| Try LTQ |
|
|---|
| ChTry LTQ |
|
|---|
| ArgC LTQ |
|
|---|
| LysN LTQ |
|
|---|
| TryLysC LTQ |
|
|---|
| Try MSlow |
|
|---|
| ChTry MSlow |
|
|---|
| ArgC MSlow |
|
|---|
| LysN MSlow |
|
|---|
| TryLysC MSlow |
|
|---|
| Try MShigh |
|
|---|
| ChTry MShigh |
|
|---|
| ArgC MShigh |
|
|---|
| LysN MShigh |
|
|---|
| TryLysC MShigh |
|
|---|
General Statistics
Number of major isoforms |
Number of additional isoforms |
Number of all proteins |
Number of amino acids |
Min. Seq. Length |
Max. Seq. Length |
Avg. Seq. Length |
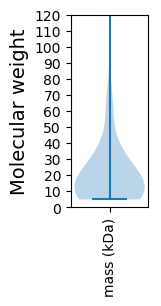
Avg. Mol. Weight |
|---|---|---|---|---|---|---|---|
0 |
11382 |
40 |
1737 |
196.2 |
21.73 |
Amino acid frequency
Ala |
Cys |
Asp |
Glu |
Phe |
Gly |
His |
Ile |
Lys |
Leu |
|---|---|---|---|---|---|---|---|---|---|
9.085 ± 0.423 | 0.756 ± 0.205 |
5.737 ± 0.31 | 6.431 ± 0.47 |
3.453 ± 0.227 | 7.327 ± 0.352 |
1.45 ± 0.242 | 6.018 ± 0.182 |
6.238 ± 0.435 | 8.004 ± 0.395 |
Met |
Asn |
Gln |
Pro |
Arg |
Ser |
Thr |
Val |
Trp |
Tyr |
|---|---|---|---|---|---|---|---|---|---|
2.144 ± 0.286 | 5.105 ± 0.308 |
4.252 ± 0.251 | 3.831 ± 0.256 |
4.771 ± 0.274 | 6.774 ± 0.402 |
7.152 ± 0.715 | 6.273 ± 0.26 |
1.819 ± 0.224 | 3.383 ± 0.214 |
Most of the basic statistics you can see at this page can be downloaded from this CSV file
See this proteome in:

Proteome-pI is available under Creative Commons Attribution-NoDerivs license, for more details see here
| Reference: Kozlowski LP. Proteome-pI 2.0: Proteome Isoelectric Point Database Update. Nucleic Acids Res. 2021, doi: 10.1093/nar/gkab944 | Contact: Lukasz P. Kozlowski |