Tortoise microvirus 2
Taxonomy: Viruses; Monodnaviria; Sangervirae; Phixviricota; Malgrandaviricetes; Petitvirales; Microviridae; unclassified Microviridae
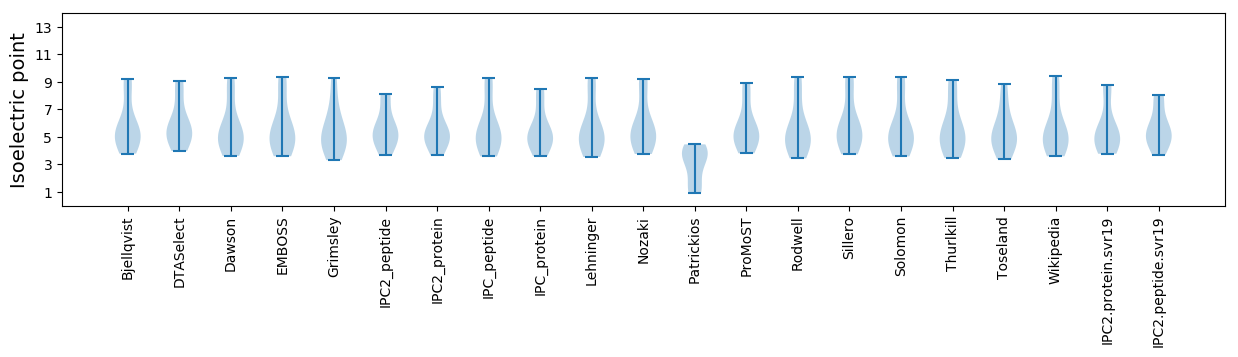
Average proteome isoelectric point is 5.67
Get precalculated fractions of proteins
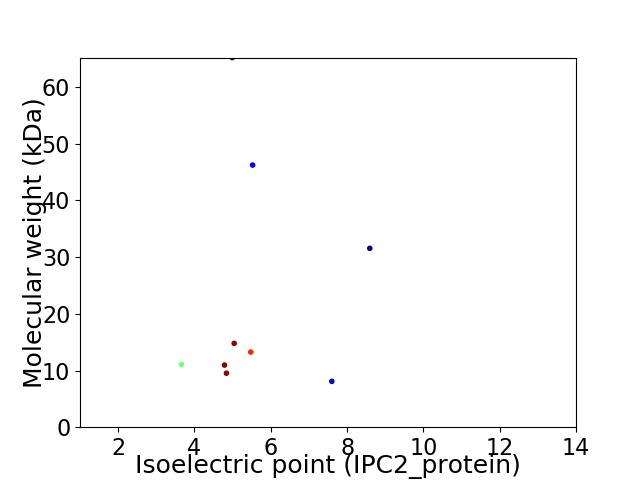
Virtual 2D-PAGE plot for 9 proteins (isoelectric point calculated using IPC2_protein)
Get csv file with sequences according to given criteria:
* You can choose from 21 different methods for calculating isoelectric point
Summary statistics related to proteome-wise predictions
Protein with the lowest isoelectric point:
>tr|A0A4P8W960|A0A4P8W960_9VIRU Uncharacterized protein OS=Tortoise microvirus 2 OX=2583121 PE=4 SV=1
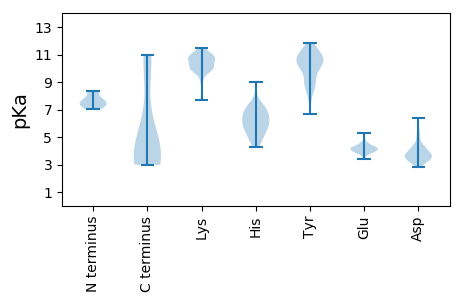
MM1 pKa = 7.75SDD3 pKa = 4.48FIPVDD8 pKa = 4.19FFTDD12 pKa = 3.16DD13 pKa = 3.44GYY15 pKa = 11.87APVPVRR21 pKa = 11.84YY22 pKa = 8.71LASPEE27 pKa = 3.86TAEE30 pKa = 3.88VFNRR34 pKa = 11.84VMSMAPTFFPDD45 pKa = 4.22LPVDD49 pKa = 4.28ANPVIAEE56 pKa = 3.94QQYY59 pKa = 11.45AMALVTLAVNFYY71 pKa = 10.79FDD73 pKa = 3.9TLGLLSPPEE82 pKa = 4.25VAPSTPVGDD91 pKa = 4.38DD92 pKa = 3.4DD93 pKa = 6.38LNIKK97 pKa = 9.51EE98 pKa = 4.31SHH100 pKa = 4.82VV101 pKa = 3.46
MM1 pKa = 7.75SDD3 pKa = 4.48FIPVDD8 pKa = 4.19FFTDD12 pKa = 3.16DD13 pKa = 3.44GYY15 pKa = 11.87APVPVRR21 pKa = 11.84YY22 pKa = 8.71LASPEE27 pKa = 3.86TAEE30 pKa = 3.88VFNRR34 pKa = 11.84VMSMAPTFFPDD45 pKa = 4.22LPVDD49 pKa = 4.28ANPVIAEE56 pKa = 3.94QQYY59 pKa = 11.45AMALVTLAVNFYY71 pKa = 10.79FDD73 pKa = 3.9TLGLLSPPEE82 pKa = 4.25VAPSTPVGDD91 pKa = 4.38DD92 pKa = 3.4DD93 pKa = 6.38LNIKK97 pKa = 9.51EE98 pKa = 4.31SHH100 pKa = 4.82VV101 pKa = 3.46
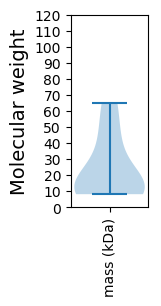
Molecular weight: 11.07 kDa
Isoelectric point according different methods:
Protein with the highest isoelectric point:
>tr|A0A4V1FVV9|A0A4V1FVV9_9VIRU Uncharacterized protein OS=Tortoise microvirus 2 OX=2583121 PE=4 SV=1
MM1 pKa = 7.04TSVMSHH7 pKa = 6.96PSQFFMILPNDD18 pKa = 3.99VYY20 pKa = 11.25RR21 pKa = 11.84LGLNPAKK28 pKa = 9.9IARR31 pKa = 11.84MAYY34 pKa = 9.9LYY36 pKa = 11.26AHH38 pKa = 7.36IADD41 pKa = 4.91CLPSDD46 pKa = 4.33VTCSPPLHH54 pKa = 6.47CTTPSLLAQRR64 pKa = 11.84AKK66 pKa = 10.77SSTGVSYY73 pKa = 11.11VV74 pKa = 2.98
MM1 pKa = 7.04TSVMSHH7 pKa = 6.96PSQFFMILPNDD18 pKa = 3.99VYY20 pKa = 11.25RR21 pKa = 11.84LGLNPAKK28 pKa = 9.9IARR31 pKa = 11.84MAYY34 pKa = 9.9LYY36 pKa = 11.26AHH38 pKa = 7.36IADD41 pKa = 4.91CLPSDD46 pKa = 4.33VTCSPPLHH54 pKa = 6.47CTTPSLLAQRR64 pKa = 11.84AKK66 pKa = 10.77SSTGVSYY73 pKa = 11.11VV74 pKa = 2.98
Molecular weight: 8.09 kDa
Isoelectric point according different methods:
Peptides (in silico digests for buttom-up proteomics)
Below you can find in silico digests of the whole proteome with Trypsin, Chymotrypsin, Trypsin+LysC, LysN, ArgC proteases suitable for different mass spec machines.| Try ESI |
 |
|---|
| ChTry ESI |
|
|---|
| ArgC ESI |
|
|---|
| LysN ESI |
|
|---|
| TryLysC ESI |
|
|---|
| Try MALDI |
|
|---|
| ChTry MALDI |
|
|---|
| ArgC MALDI |
|
|---|
| LysN MALDI |
|
|---|
| TryLysC MALDI |
|
|---|
| Try LTQ |
|
|---|
| ChTry LTQ |
|
|---|
| ArgC LTQ |
|
|---|
| LysN LTQ |
|
|---|
| TryLysC LTQ |
|
|---|
| Try MSlow |
|
|---|
| ChTry MSlow |
|
|---|
| ArgC MSlow |
|
|---|
| LysN MSlow |
|
|---|
| TryLysC MSlow |
|
|---|
| Try MShigh |
|
|---|
| ChTry MShigh |
|
|---|
| ArgC MShigh |
|
|---|
| LysN MShigh |
|
|---|
| TryLysC MShigh |
|
|---|
General Statistics
Number of major isoforms |
Number of additional isoforms |
Number of all proteins |
Number of amino acids |
Min. Seq. Length |
Max. Seq. Length |
Avg. Seq. Length |
Avg. Mol. Weight |
|---|---|---|---|---|---|---|---|
0 |
1885 |
74 |
584 |
209.4 |
23.41 |
Amino acid frequency
Ala |
Cys |
Asp |
Glu |
Phe |
Gly |
His |
Ile |
Lys |
Leu |
|---|---|---|---|---|---|---|---|---|---|
7.692 ± 1.065 | 1.432 ± 0.541 |
6.578 ± 0.474 | 4.35 ± 0.692 |
5.146 ± 0.488 | 5.889 ± 0.686 |
1.804 ± 0.282 | 4.191 ± 0.61 |
3.607 ± 1.148 | 9.231 ± 0.978 |
Met |
Asn |
Gln |
Pro |
Arg |
Ser |
Thr |
Val |
Trp |
Tyr |
|---|---|---|---|---|---|---|---|---|---|
2.865 ± 0.324 | 4.721 ± 0.29 |
5.995 ± 0.741 | 4.403 ± 1.571 |
5.517 ± 0.467 | 8.806 ± 1.08 |
5.942 ± 0.521 | 6.26 ± 0.706 |
0.584 ± 0.16 | 4.987 ± 0.704 |
Most of the basic statistics you can see at this page can be downloaded from this CSV file
See this proteome in:

Proteome-pI is available under Creative Commons Attribution-NoDerivs license, for more details see here
| Reference: Kozlowski LP. Proteome-pI 2.0: Proteome Isoelectric Point Database Update. Nucleic Acids Res. 2021, doi: 10.1093/nar/gkab944 | Contact: Lukasz P. Kozlowski |