Acidibacillus ferrooxidans
Taxonomy: cellular organisms; Bacteria; Terrabacteria group; Firmicutes; Bacilli; Bacillales; Bacillales incertae sedis; Acidibacillus
Average proteome isoelectric point is 6.71
Get precalculated fractions of proteins
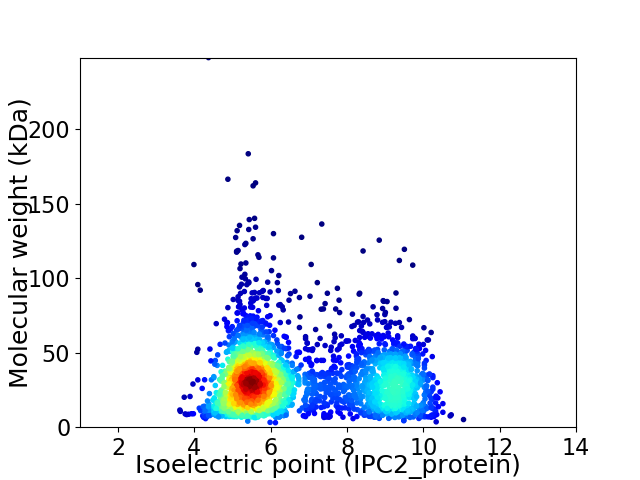
Virtual 2D-PAGE plot for 2881 proteins (isoelectric point calculated using IPC2_protein)
Get csv file with sequences according to given criteria:
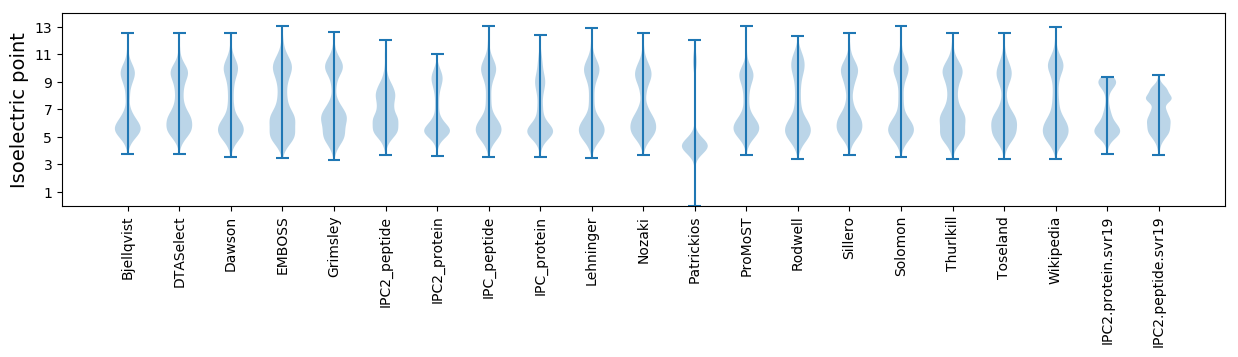
* You can choose from 21 different methods for calculating isoelectric point
Summary statistics related to proteome-wise predictions
Protein with the lowest isoelectric point:
>tr|A0A162TKE9|A0A162TKE9_9BACL Fe-S cluster assembly protein SufB OS=Acidibacillus ferrooxidans OX=1765683 GN=AYJ22_01715 PE=3 SV=1
MM1 pKa = 7.48AAFVSVGAFQVASVANDD18 pKa = 2.89VGFFYY23 pKa = 10.59GQNVQNAWDD32 pKa = 3.64SHH34 pKa = 7.11APLQMGAGFTMGNYY48 pKa = 10.73DD49 pKa = 3.94LMNNAGIVSNTPAAVLQPINDD70 pKa = 3.52QDD72 pKa = 3.85VKK74 pKa = 11.71DD75 pKa = 4.06NFSPSWQGPP84 pKa = 3.36
MM1 pKa = 7.48AAFVSVGAFQVASVANDD18 pKa = 2.89VGFFYY23 pKa = 10.59GQNVQNAWDD32 pKa = 3.64SHH34 pKa = 7.11APLQMGAGFTMGNYY48 pKa = 10.73DD49 pKa = 3.94LMNNAGIVSNTPAAVLQPINDD70 pKa = 3.52QDD72 pKa = 3.85VKK74 pKa = 11.71DD75 pKa = 4.06NFSPSWQGPP84 pKa = 3.36
Molecular weight: 8.91 kDa
Isoelectric point according different methods:
Protein with the highest isoelectric point:
>tr|A0A1V4EVF0|A0A1V4EVF0_9BACL Flagellar hook-associated protein 1 OS=Acidibacillus ferrooxidans OX=1765683 GN=flgK PE=3 SV=1
MM1 pKa = 7.52KK2 pKa = 8.58PTYY5 pKa = 9.95NPNVRR10 pKa = 11.84KK11 pKa = 9.7RR12 pKa = 11.84KK13 pKa = 8.69KK14 pKa = 8.48VHH16 pKa = 5.57GFRR19 pKa = 11.84SRR21 pKa = 11.84MSTKK25 pKa = 9.61NGRR28 pKa = 11.84RR29 pKa = 11.84VLSARR34 pKa = 11.84RR35 pKa = 11.84SKK37 pKa = 10.29GRR39 pKa = 11.84KK40 pKa = 8.93VISAA44 pKa = 4.05
MM1 pKa = 7.52KK2 pKa = 8.58PTYY5 pKa = 9.95NPNVRR10 pKa = 11.84KK11 pKa = 9.7RR12 pKa = 11.84KK13 pKa = 8.69KK14 pKa = 8.48VHH16 pKa = 5.57GFRR19 pKa = 11.84SRR21 pKa = 11.84MSTKK25 pKa = 9.61NGRR28 pKa = 11.84RR29 pKa = 11.84VLSARR34 pKa = 11.84RR35 pKa = 11.84SKK37 pKa = 10.29GRR39 pKa = 11.84KK40 pKa = 8.93VISAA44 pKa = 4.05
Molecular weight: 5.14 kDa
Isoelectric point according different methods:
Peptides (in silico digests for buttom-up proteomics)
Below you can find in silico digests of the whole proteome with Trypsin, Chymotrypsin, Trypsin+LysC, LysN, ArgC proteases suitable for different mass spec machines.| Try ESI |
 |
|---|
| ChTry ESI |
|
|---|
| ArgC ESI |
|
|---|
| LysN ESI |
|
|---|
| TryLysC ESI |
|
|---|
| Try MALDI |
|
|---|
| ChTry MALDI |
|
|---|
| ArgC MALDI |
|
|---|
| LysN MALDI |
|
|---|
| TryLysC MALDI |
|
|---|
| Try LTQ |
|
|---|
| ChTry LTQ |
|
|---|
| ArgC LTQ |
|
|---|
| LysN LTQ |
|
|---|
| TryLysC LTQ |
|
|---|
| Try MSlow |
|
|---|
| ChTry MSlow |
|
|---|
| ArgC MSlow |
|
|---|
| LysN MSlow |
|
|---|
| TryLysC MSlow |
|
|---|
| Try MShigh |
|
|---|
| ChTry MShigh |
|
|---|
| ArgC MShigh |
|
|---|
| LysN MShigh |
|
|---|
| TryLysC MShigh |
|
|---|
General Statistics
Number of major isoforms |
Number of additional isoforms |
Number of all proteins |
Number of amino acids |
Min. Seq. Length |
Max. Seq. Length |
Avg. Seq. Length |
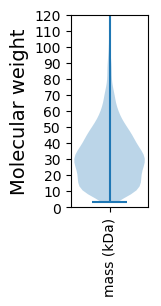
Avg. Mol. Weight |
|---|---|---|---|---|---|---|---|
0 |
885484 |
25 |
2363 |
307.4 |
33.99 |
Amino acid frequency
Ala |
Cys |
Asp |
Glu |
Phe |
Gly |
His |
Ile |
Lys |
Leu |
|---|---|---|---|---|---|---|---|---|---|
9.632 ± 0.05 | 0.851 ± 0.015 |
4.906 ± 0.043 | 5.946 ± 0.057 |
3.998 ± 0.034 | 7.413 ± 0.047 |
2.554 ± 0.022 | 5.958 ± 0.041 |
3.763 ± 0.035 | 10.525 ± 0.062 |
Met |
Asn |
Gln |
Pro |
Arg |
Ser |
Thr |
Val |
Trp |
Tyr |
|---|---|---|---|---|---|---|---|---|---|
2.773 ± 0.023 | 2.99 ± 0.034 |
4.262 ± 0.03 | 3.884 ± 0.03 |
6.505 ± 0.05 | 6.215 ± 0.043 |
5.844 ± 0.039 | 7.917 ± 0.04 |
1.165 ± 0.02 | 2.899 ± 0.026 |
Most of the basic statistics you can see at this page can be downloaded from this CSV file
See this proteome in:

Proteome-pI is available under Creative Commons Attribution-NoDerivs license, for more details see here
| Reference: Kozlowski LP. Proteome-pI 2.0: Proteome Isoelectric Point Database Update. Nucleic Acids Res. 2021, doi: 10.1093/nar/gkab944 | Contact: Lukasz P. Kozlowski |