Jannaschia aquimarina
Taxonomy: cellular organisms; Bacteria; Proteobacteria; Alphaproteobacteria; Rhodobacterales; Roseobacteraceae; Jannaschia
Average proteome isoelectric point is 6.08
Get precalculated fractions of proteins
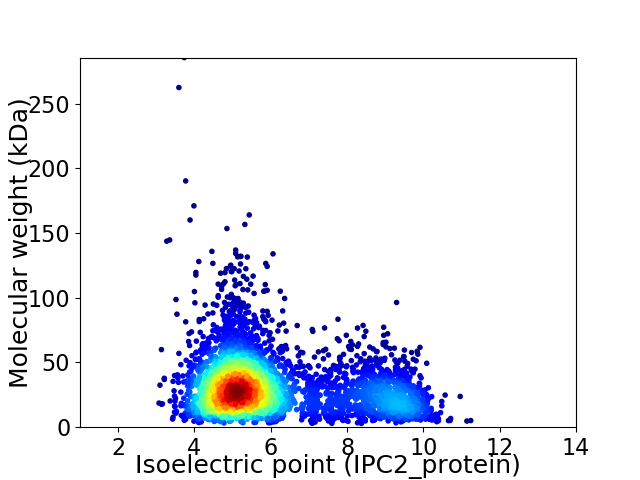
Virtual 2D-PAGE plot for 4049 proteins (isoelectric point calculated using IPC2_protein)
Get csv file with sequences according to given criteria:
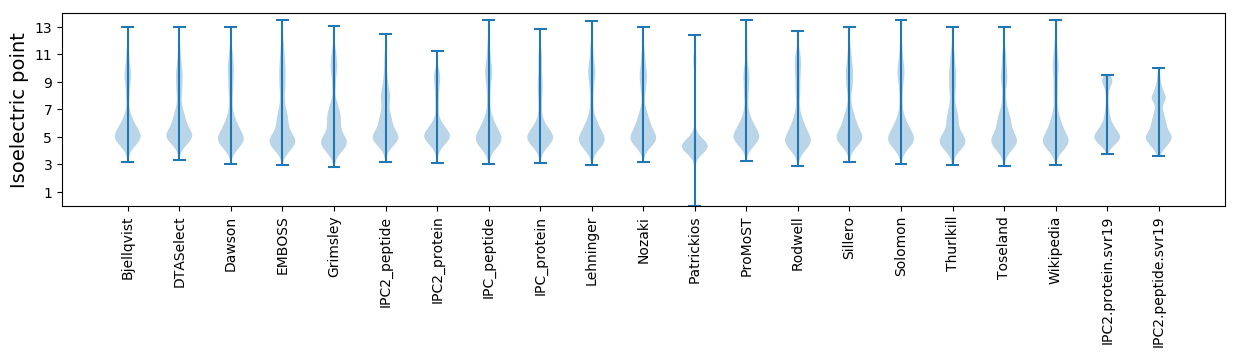
* You can choose from 21 different methods for calculating isoelectric point
Summary statistics related to proteome-wise predictions
Protein with the lowest isoelectric point:
>tr|A0A0D1EBF1|A0A0D1EBF1_9RHOB EamA-like transporter family protein OS=Jannaschia aquimarina OX=935700 GN=jaqu_40300 PE=4 SV=1
MM1 pKa = 7.79DD2 pKa = 5.44RR3 pKa = 11.84APVTGRR9 pKa = 11.84NITKK13 pKa = 9.43TIQLASASALALVGATFGTAAAAEE37 pKa = 4.28DD38 pKa = 4.73LTLCWAAWDD47 pKa = 3.79PANALVEE54 pKa = 3.93LSKK57 pKa = 11.18DD58 pKa = 3.39FEE60 pKa = 4.44EE61 pKa = 5.12QSGHH65 pKa = 4.04TMNFEE70 pKa = 4.18FVPWPNFADD79 pKa = 3.92RR80 pKa = 11.84MLNEE84 pKa = 4.6LNSGGQLCDD93 pKa = 4.12LMIGDD98 pKa = 4.62SQWIGGGAEE107 pKa = 3.67NGHH110 pKa = 5.09YY111 pKa = 10.7VKK113 pKa = 11.07LNDD116 pKa = 3.73FFEE119 pKa = 5.99ASDD122 pKa = 3.28ISMDD126 pKa = 3.96DD127 pKa = 3.39FADD130 pKa = 3.77AAVYY134 pKa = 9.81AYY136 pKa = 7.65STWPKK141 pKa = 9.25GTEE144 pKa = 3.61NYY146 pKa = 9.38YY147 pKa = 11.01ALPAMGDD154 pKa = 3.45ANGWFYY160 pKa = 11.3RR161 pKa = 11.84KK162 pKa = 9.89DD163 pKa = 3.1WFTDD167 pKa = 3.65PEE169 pKa = 3.79IMAAFEE175 pKa = 4.49AEE177 pKa = 3.94HH178 pKa = 6.27GRR180 pKa = 11.84PLGEE184 pKa = 4.04PQTQRR189 pKa = 11.84EE190 pKa = 4.3LMEE193 pKa = 3.96IAKK196 pKa = 9.06FFQGRR201 pKa = 11.84EE202 pKa = 3.34IDD204 pKa = 3.55GQEE207 pKa = 3.91RR208 pKa = 11.84YY209 pKa = 9.79GVSIFTEE216 pKa = 4.45RR217 pKa = 11.84GSEE220 pKa = 4.3GITMGVTGALYY231 pKa = 10.09AWGLEE236 pKa = 4.18YY237 pKa = 10.82EE238 pKa = 4.6NEE240 pKa = 4.13PGSYY244 pKa = 11.42DD245 pKa = 3.08MVGAMNSPEE254 pKa = 3.93AVEE257 pKa = 4.49ALEE260 pKa = 5.59FYY262 pKa = 10.67TEE264 pKa = 4.99LYY266 pKa = 9.22EE267 pKa = 4.6CCTPPGYY274 pKa = 9.33TNSYY278 pKa = 8.86MGEE281 pKa = 3.96SLDD284 pKa = 3.81AFKK287 pKa = 10.9SGQVAMAMNWFAFFPGLYY305 pKa = 9.69ADD307 pKa = 4.8PDD309 pKa = 3.51IGGDD313 pKa = 3.51KK314 pKa = 10.18IDD316 pKa = 4.49FFVNPPQNQEE326 pKa = 3.33ASTLGGQGISVVSYY340 pKa = 10.41PDD342 pKa = 3.31KK343 pKa = 10.94QDD345 pKa = 3.19AALEE349 pKa = 4.19YY350 pKa = 10.08IAWFAQPEE358 pKa = 4.37VQKK361 pKa = 10.64QWWALGGYY369 pKa = 8.97AVHH372 pKa = 7.39DD373 pKa = 4.21AVLEE377 pKa = 4.36DD378 pKa = 3.72PAFEE382 pKa = 4.1EE383 pKa = 4.49SQPFAGDD390 pKa = 3.59FLQAMNAVQDD400 pKa = 4.34FWQEE404 pKa = 3.47PTYY407 pKa = 11.4AEE409 pKa = 4.76LLLAMQEE416 pKa = 4.15RR417 pKa = 11.84VHH419 pKa = 7.17NYY421 pKa = 8.34VVADD425 pKa = 3.36QGTAQEE431 pKa = 4.86ALDD434 pKa = 4.46ALIEE438 pKa = 4.4DD439 pKa = 3.73WTEE442 pKa = 3.71VFEE445 pKa = 6.98DD446 pKa = 4.36DD447 pKa = 5.22GKK449 pKa = 11.47LL450 pKa = 3.4
MM1 pKa = 7.79DD2 pKa = 5.44RR3 pKa = 11.84APVTGRR9 pKa = 11.84NITKK13 pKa = 9.43TIQLASASALALVGATFGTAAAAEE37 pKa = 4.28DD38 pKa = 4.73LTLCWAAWDD47 pKa = 3.79PANALVEE54 pKa = 3.93LSKK57 pKa = 11.18DD58 pKa = 3.39FEE60 pKa = 4.44EE61 pKa = 5.12QSGHH65 pKa = 4.04TMNFEE70 pKa = 4.18FVPWPNFADD79 pKa = 3.92RR80 pKa = 11.84MLNEE84 pKa = 4.6LNSGGQLCDD93 pKa = 4.12LMIGDD98 pKa = 4.62SQWIGGGAEE107 pKa = 3.67NGHH110 pKa = 5.09YY111 pKa = 10.7VKK113 pKa = 11.07LNDD116 pKa = 3.73FFEE119 pKa = 5.99ASDD122 pKa = 3.28ISMDD126 pKa = 3.96DD127 pKa = 3.39FADD130 pKa = 3.77AAVYY134 pKa = 9.81AYY136 pKa = 7.65STWPKK141 pKa = 9.25GTEE144 pKa = 3.61NYY146 pKa = 9.38YY147 pKa = 11.01ALPAMGDD154 pKa = 3.45ANGWFYY160 pKa = 11.3RR161 pKa = 11.84KK162 pKa = 9.89DD163 pKa = 3.1WFTDD167 pKa = 3.65PEE169 pKa = 3.79IMAAFEE175 pKa = 4.49AEE177 pKa = 3.94HH178 pKa = 6.27GRR180 pKa = 11.84PLGEE184 pKa = 4.04PQTQRR189 pKa = 11.84EE190 pKa = 4.3LMEE193 pKa = 3.96IAKK196 pKa = 9.06FFQGRR201 pKa = 11.84EE202 pKa = 3.34IDD204 pKa = 3.55GQEE207 pKa = 3.91RR208 pKa = 11.84YY209 pKa = 9.79GVSIFTEE216 pKa = 4.45RR217 pKa = 11.84GSEE220 pKa = 4.3GITMGVTGALYY231 pKa = 10.09AWGLEE236 pKa = 4.18YY237 pKa = 10.82EE238 pKa = 4.6NEE240 pKa = 4.13PGSYY244 pKa = 11.42DD245 pKa = 3.08MVGAMNSPEE254 pKa = 3.93AVEE257 pKa = 4.49ALEE260 pKa = 5.59FYY262 pKa = 10.67TEE264 pKa = 4.99LYY266 pKa = 9.22EE267 pKa = 4.6CCTPPGYY274 pKa = 9.33TNSYY278 pKa = 8.86MGEE281 pKa = 3.96SLDD284 pKa = 3.81AFKK287 pKa = 10.9SGQVAMAMNWFAFFPGLYY305 pKa = 9.69ADD307 pKa = 4.8PDD309 pKa = 3.51IGGDD313 pKa = 3.51KK314 pKa = 10.18IDD316 pKa = 4.49FFVNPPQNQEE326 pKa = 3.33ASTLGGQGISVVSYY340 pKa = 10.41PDD342 pKa = 3.31KK343 pKa = 10.94QDD345 pKa = 3.19AALEE349 pKa = 4.19YY350 pKa = 10.08IAWFAQPEE358 pKa = 4.37VQKK361 pKa = 10.64QWWALGGYY369 pKa = 8.97AVHH372 pKa = 7.39DD373 pKa = 4.21AVLEE377 pKa = 4.36DD378 pKa = 3.72PAFEE382 pKa = 4.1EE383 pKa = 4.49SQPFAGDD390 pKa = 3.59FLQAMNAVQDD400 pKa = 4.34FWQEE404 pKa = 3.47PTYY407 pKa = 11.4AEE409 pKa = 4.76LLLAMQEE416 pKa = 4.15RR417 pKa = 11.84VHH419 pKa = 7.17NYY421 pKa = 8.34VVADD425 pKa = 3.36QGTAQEE431 pKa = 4.86ALDD434 pKa = 4.46ALIEE438 pKa = 4.4DD439 pKa = 3.73WTEE442 pKa = 3.71VFEE445 pKa = 6.98DD446 pKa = 4.36DD447 pKa = 5.22GKK449 pKa = 11.47LL450 pKa = 3.4
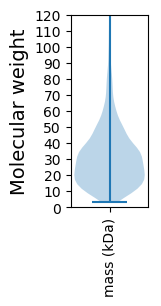
Molecular weight: 49.89 kDa
Isoelectric point according different methods:
Protein with the highest isoelectric point:
>tr|A0A0D1EL05|A0A0D1EL05_9RHOB Uncharacterized protein OS=Jannaschia aquimarina OX=935700 GN=jaqu_05570 PE=4 SV=1
MM1 pKa = 7.45KK2 pKa = 9.61RR3 pKa = 11.84TFQPSNLVRR12 pKa = 11.84KK13 pKa = 9.18RR14 pKa = 11.84RR15 pKa = 11.84HH16 pKa = 4.42GFRR19 pKa = 11.84ARR21 pKa = 11.84MATKK25 pKa = 10.37AGRR28 pKa = 11.84KK29 pKa = 8.54ILNARR34 pKa = 11.84RR35 pKa = 11.84ARR37 pKa = 11.84GRR39 pKa = 11.84KK40 pKa = 9.07SLSAA44 pKa = 3.93
MM1 pKa = 7.45KK2 pKa = 9.61RR3 pKa = 11.84TFQPSNLVRR12 pKa = 11.84KK13 pKa = 9.18RR14 pKa = 11.84RR15 pKa = 11.84HH16 pKa = 4.42GFRR19 pKa = 11.84ARR21 pKa = 11.84MATKK25 pKa = 10.37AGRR28 pKa = 11.84KK29 pKa = 8.54ILNARR34 pKa = 11.84RR35 pKa = 11.84ARR37 pKa = 11.84GRR39 pKa = 11.84KK40 pKa = 9.07SLSAA44 pKa = 3.93
Molecular weight: 5.14 kDa
Isoelectric point according different methods:
Peptides (in silico digests for buttom-up proteomics)
Below you can find in silico digests of the whole proteome with Trypsin, Chymotrypsin, Trypsin+LysC, LysN, ArgC proteases suitable for different mass spec machines.| Try ESI |
 |
|---|
| ChTry ESI |
|
|---|
| ArgC ESI |
|
|---|
| LysN ESI |
|
|---|
| TryLysC ESI |
|
|---|
| Try MALDI |
|
|---|
| ChTry MALDI |
|
|---|
| ArgC MALDI |
|
|---|
| LysN MALDI |
|
|---|
| TryLysC MALDI |
|
|---|
| Try LTQ |
|
|---|
| ChTry LTQ |
|
|---|
| ArgC LTQ |
|
|---|
| LysN LTQ |
|
|---|
| TryLysC LTQ |
|
|---|
| Try MSlow |
|
|---|
| ChTry MSlow |
|
|---|
| ArgC MSlow |
|
|---|
| LysN MSlow |
|
|---|
| TryLysC MSlow |
|
|---|
| Try MShigh |
|
|---|
| ChTry MShigh |
|
|---|
| ArgC MShigh |
|
|---|
| LysN MShigh |
|
|---|
| TryLysC MShigh |
|
|---|
General Statistics
Number of major isoforms |
Number of additional isoforms |
Number of all proteins |
Number of amino acids |
Min. Seq. Length |
Max. Seq. Length |
Avg. Seq. Length |
Avg. Mol. Weight |
|---|---|---|---|---|---|---|---|
0 |
1221941 |
29 |
2795 |
301.8 |
32.61 |
Amino acid frequency
Ala |
Cys |
Asp |
Glu |
Phe |
Gly |
His |
Ile |
Lys |
Leu |
|---|---|---|---|---|---|---|---|---|---|
13.113 ± 0.062 | 0.844 ± 0.012 |
6.527 ± 0.037 | 6.065 ± 0.04 |
3.478 ± 0.022 | 9.123 ± 0.049 |
1.988 ± 0.021 | 4.721 ± 0.025 |
2.269 ± 0.033 | 10.155 ± 0.05 |
Met |
Asn |
Gln |
Pro |
Arg |
Ser |
Thr |
Val |
Trp |
Tyr |
|---|---|---|---|---|---|---|---|---|---|
2.592 ± 0.022 | 2.104 ± 0.024 |
5.455 ± 0.034 | 2.724 ± 0.022 |
7.68 ± 0.045 | 4.78 ± 0.024 |
5.493 ± 0.036 | 7.406 ± 0.036 |
1.516 ± 0.016 | 1.967 ± 0.02 |
Most of the basic statistics you can see at this page can be downloaded from this CSV file
See this proteome in:

Proteome-pI is available under Creative Commons Attribution-NoDerivs license, for more details see here
| Reference: Kozlowski LP. Proteome-pI 2.0: Proteome Isoelectric Point Database Update. Nucleic Acids Res. 2021, doi: 10.1093/nar/gkab944 | Contact: Lukasz P. Kozlowski |