Pachysolen tannophilus NRRL Y-2460
Taxonomy: cellular organisms; Eukaryota; Opisthokonta; Fungi; Dikarya; Ascomycota; saccharomyceta; Saccharomycotina; Saccharomycetes; Saccharomycetales; Saccharomycetaceae; Pachysolen; Pachysolen tannophilus
Average proteome isoelectric point is 6.42
Get precalculated fractions of proteins
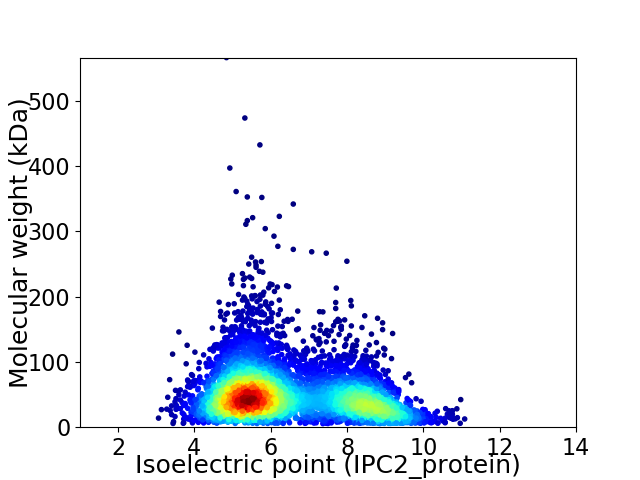
Virtual 2D-PAGE plot for 5645 proteins (isoelectric point calculated using IPC2_protein)
Get csv file with sequences according to given criteria:
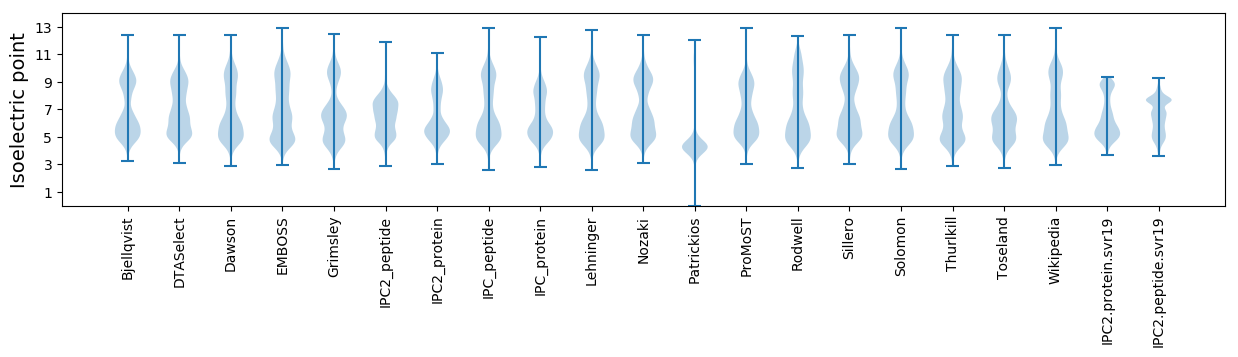
* You can choose from 21 different methods for calculating isoelectric point
Summary statistics related to proteome-wise predictions
Protein with the lowest isoelectric point:
>tr|A0A1E4U1I7|A0A1E4U1I7_PACTA Uncharacterized protein OS=Pachysolen tannophilus NRRL Y-2460 OX=669874 GN=PACTADRAFT_47700 PE=4 SV=1
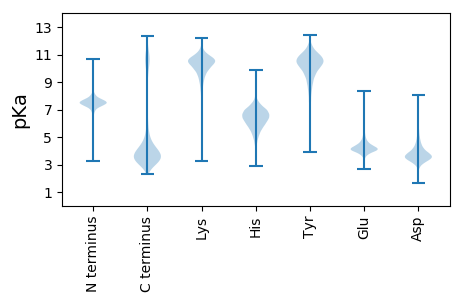
MM1 pKa = 7.37LVDD4 pKa = 4.23KK5 pKa = 10.71KK6 pKa = 11.13LIAAVVALASATVSAKK22 pKa = 10.63GSFGFDD28 pKa = 2.94LGVVDD33 pKa = 6.14NDD35 pKa = 4.9DD36 pKa = 3.65NCKK39 pKa = 10.72DD40 pKa = 3.56ADD42 pKa = 4.8DD43 pKa = 5.14YY44 pKa = 11.7IADD47 pKa = 4.31LDD49 pKa = 4.79AISGYY54 pKa = 7.59TSHH57 pKa = 6.43VKK59 pKa = 9.61TYY61 pKa = 10.93AVSDD65 pKa = 4.28CNTLQILGPVLEE77 pKa = 5.28DD78 pKa = 2.95KK79 pKa = 11.33GFTITLGVWPTDD91 pKa = 3.42DD92 pKa = 3.27NHH94 pKa = 7.02FDD96 pKa = 3.75EE97 pKa = 6.13EE98 pKa = 4.3ISALQSYY105 pKa = 10.24LPTISKK111 pKa = 10.46SVISEE116 pKa = 3.76ITVGSEE122 pKa = 3.28VLYY125 pKa = 10.98RR126 pKa = 11.84GDD128 pKa = 3.37LTADD132 pKa = 3.3QLASKK137 pKa = 8.4ITQVKK142 pKa = 8.4STISSITDD150 pKa = 3.35KK151 pKa = 11.6NGDD154 pKa = 3.99SYY156 pKa = 12.11SDD158 pKa = 3.48IPVGTVDD165 pKa = 3.65SWNCLVDD172 pKa = 4.02SSAVDD177 pKa = 4.85AITASDD183 pKa = 3.92FVFANAFSYY192 pKa = 9.5WQGQTLANASFSFFDD207 pKa = 6.33DD208 pKa = 2.89IMQALQVIQTAKK220 pKa = 10.58GSTDD224 pKa = 2.54ILFAVGEE231 pKa = 4.66TGWPTQGTSYY241 pKa = 11.35GDD243 pKa = 3.82AVPSTANAQTFFEE256 pKa = 4.25QGVCAMLGWGVDD268 pKa = 3.48VIYY271 pKa = 10.78FEE273 pKa = 6.09AFDD276 pKa = 4.5EE277 pKa = 4.45PWKK280 pKa = 11.0AGGSGTADD288 pKa = 3.04VEE290 pKa = 4.38PYY292 pKa = 10.59YY293 pKa = 11.08GAFDD297 pKa = 3.59DD298 pKa = 4.01TRR300 pKa = 11.84TLKK303 pKa = 10.72FPLTCNYY310 pKa = 8.71TGSSS314 pKa = 3.42
MM1 pKa = 7.37LVDD4 pKa = 4.23KK5 pKa = 10.71KK6 pKa = 11.13LIAAVVALASATVSAKK22 pKa = 10.63GSFGFDD28 pKa = 2.94LGVVDD33 pKa = 6.14NDD35 pKa = 4.9DD36 pKa = 3.65NCKK39 pKa = 10.72DD40 pKa = 3.56ADD42 pKa = 4.8DD43 pKa = 5.14YY44 pKa = 11.7IADD47 pKa = 4.31LDD49 pKa = 4.79AISGYY54 pKa = 7.59TSHH57 pKa = 6.43VKK59 pKa = 9.61TYY61 pKa = 10.93AVSDD65 pKa = 4.28CNTLQILGPVLEE77 pKa = 5.28DD78 pKa = 2.95KK79 pKa = 11.33GFTITLGVWPTDD91 pKa = 3.42DD92 pKa = 3.27NHH94 pKa = 7.02FDD96 pKa = 3.75EE97 pKa = 6.13EE98 pKa = 4.3ISALQSYY105 pKa = 10.24LPTISKK111 pKa = 10.46SVISEE116 pKa = 3.76ITVGSEE122 pKa = 3.28VLYY125 pKa = 10.98RR126 pKa = 11.84GDD128 pKa = 3.37LTADD132 pKa = 3.3QLASKK137 pKa = 8.4ITQVKK142 pKa = 8.4STISSITDD150 pKa = 3.35KK151 pKa = 11.6NGDD154 pKa = 3.99SYY156 pKa = 12.11SDD158 pKa = 3.48IPVGTVDD165 pKa = 3.65SWNCLVDD172 pKa = 4.02SSAVDD177 pKa = 4.85AITASDD183 pKa = 3.92FVFANAFSYY192 pKa = 9.5WQGQTLANASFSFFDD207 pKa = 6.33DD208 pKa = 2.89IMQALQVIQTAKK220 pKa = 10.58GSTDD224 pKa = 2.54ILFAVGEE231 pKa = 4.66TGWPTQGTSYY241 pKa = 11.35GDD243 pKa = 3.82AVPSTANAQTFFEE256 pKa = 4.25QGVCAMLGWGVDD268 pKa = 3.48VIYY271 pKa = 10.78FEE273 pKa = 6.09AFDD276 pKa = 4.5EE277 pKa = 4.45PWKK280 pKa = 11.0AGGSGTADD288 pKa = 3.04VEE290 pKa = 4.38PYY292 pKa = 10.59YY293 pKa = 11.08GAFDD297 pKa = 3.59DD298 pKa = 4.01TRR300 pKa = 11.84TLKK303 pKa = 10.72FPLTCNYY310 pKa = 8.71TGSSS314 pKa = 3.42
Molecular weight: 33.55 kDa
Isoelectric point according different methods:
Protein with the highest isoelectric point:
>tr|A0A1E4TRM5|A0A1E4TRM5_PACTA Protein transport protein SEC22 OS=Pachysolen tannophilus NRRL Y-2460 OX=669874 GN=PACTADRAFT_18113 PE=3 SV=1
MM1 pKa = 7.52LPNIRR6 pKa = 11.84RR7 pKa = 11.84LFASFRR13 pKa = 11.84TEE15 pKa = 3.94EE16 pKa = 3.99EE17 pKa = 3.67EE18 pKa = 4.56KK19 pKa = 10.43IYY21 pKa = 10.73SRR23 pKa = 11.84KK24 pKa = 10.19AFYY27 pKa = 11.12NFLGFLASCVAFSFVAQQLARR48 pKa = 11.84QPRR51 pKa = 11.84EE52 pKa = 3.94LIHH55 pKa = 6.24AARR58 pKa = 11.84VNALLSAIQRR68 pKa = 11.84SS69 pKa = 3.62
MM1 pKa = 7.52LPNIRR6 pKa = 11.84RR7 pKa = 11.84LFASFRR13 pKa = 11.84TEE15 pKa = 3.94EE16 pKa = 3.99EE17 pKa = 3.67EE18 pKa = 4.56KK19 pKa = 10.43IYY21 pKa = 10.73SRR23 pKa = 11.84KK24 pKa = 10.19AFYY27 pKa = 11.12NFLGFLASCVAFSFVAQQLARR48 pKa = 11.84QPRR51 pKa = 11.84EE52 pKa = 3.94LIHH55 pKa = 6.24AARR58 pKa = 11.84VNALLSAIQRR68 pKa = 11.84SS69 pKa = 3.62
Molecular weight: 7.99 kDa
Isoelectric point according different methods:
Peptides (in silico digests for buttom-up proteomics)
Below you can find in silico digests of the whole proteome with Trypsin, Chymotrypsin, Trypsin+LysC, LysN, ArgC proteases suitable for different mass spec machines.| Try ESI |
 |
|---|
| ChTry ESI |
|
|---|
| ArgC ESI |
|
|---|
| LysN ESI |
|
|---|
| TryLysC ESI |
|
|---|
| Try MALDI |
|
|---|
| ChTry MALDI |
|
|---|
| ArgC MALDI |
|
|---|
| LysN MALDI |
|
|---|
| TryLysC MALDI |
|
|---|
| Try LTQ |
|
|---|
| ChTry LTQ |
|
|---|
| ArgC LTQ |
|
|---|
| LysN LTQ |
|
|---|
| TryLysC LTQ |
|
|---|
| Try MSlow |
|
|---|
| ChTry MSlow |
|
|---|
| ArgC MSlow |
|
|---|
| LysN MSlow |
|
|---|
| TryLysC MSlow |
|
|---|
| Try MShigh |
|
|---|
| ChTry MShigh |
|
|---|
| ArgC MShigh |
|
|---|
| LysN MShigh |
|
|---|
| TryLysC MShigh |
|
|---|
General Statistics
Number of major isoforms |
Number of additional isoforms |
Number of all proteins |
Number of amino acids |
Min. Seq. Length |
Max. Seq. Length |
Avg. Seq. Length |
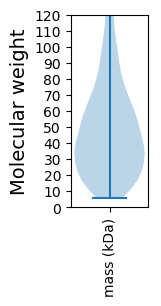
Avg. Mol. Weight |
|---|---|---|---|---|---|---|---|
2707834 |
49 |
4960 |
479.7 |
54.23 |
Amino acid frequency
Ala |
Cys |
Asp |
Glu |
Phe |
Gly |
His |
Ile |
Lys |
Leu |
|---|---|---|---|---|---|---|---|---|---|
5.17 ± 0.035 | 1.137 ± 0.011 |
5.987 ± 0.026 | 6.707 ± 0.034 |
4.643 ± 0.024 | 5.086 ± 0.031 |
1.881 ± 0.011 | 7.361 ± 0.028 |
7.751 ± 0.038 | 9.641 ± 0.039 |
Met |
Asn |
Gln |
Pro |
Arg |
Ser |
Thr |
Val |
Trp |
Tyr |
|---|---|---|---|---|---|---|---|---|---|
1.701 ± 0.009 | 7.431 ± 0.041 |
3.904 ± 0.022 | 3.81 ± 0.029 |
3.838 ± 0.016 | 9.119 ± 0.042 |
5.253 ± 0.025 | 5.213 ± 0.023 |
0.923 ± 0.008 | 3.446 ± 0.016 |
Most of the basic statistics you can see at this page can be downloaded from this CSV file
See this proteome in:

Proteome-pI is available under Creative Commons Attribution-NoDerivs license, for more details see here
| Reference: Kozlowski LP. Proteome-pI 2.0: Proteome Isoelectric Point Database Update. Nucleic Acids Res. 2021, doi: 10.1093/nar/gkab944 | Contact: Lukasz P. Kozlowski |