Salinisphaera shabanensis E1L3A
Taxonomy: cellular organisms; Bacteria; Proteobacteria; Gammaproteobacteria; Salinisphaerales; Salinisphaeraceae; Salinisphaera; Salinisphaera shabanensis
Average proteome isoelectric point is 6.12
Get precalculated fractions of proteins
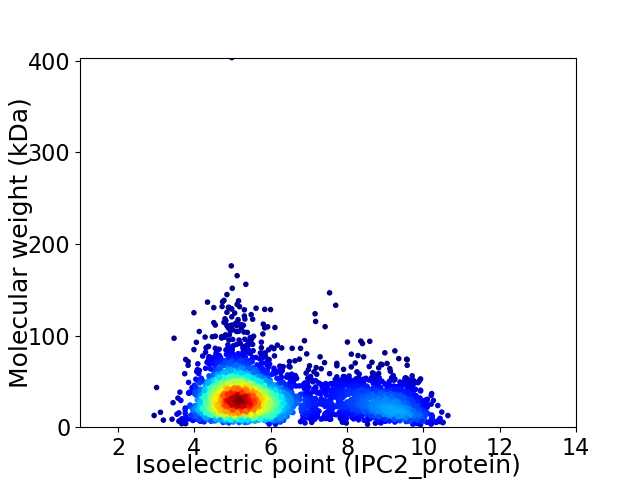
Virtual 2D-PAGE plot for 3524 proteins (isoelectric point calculated using IPC2_protein)
Get csv file with sequences according to given criteria:
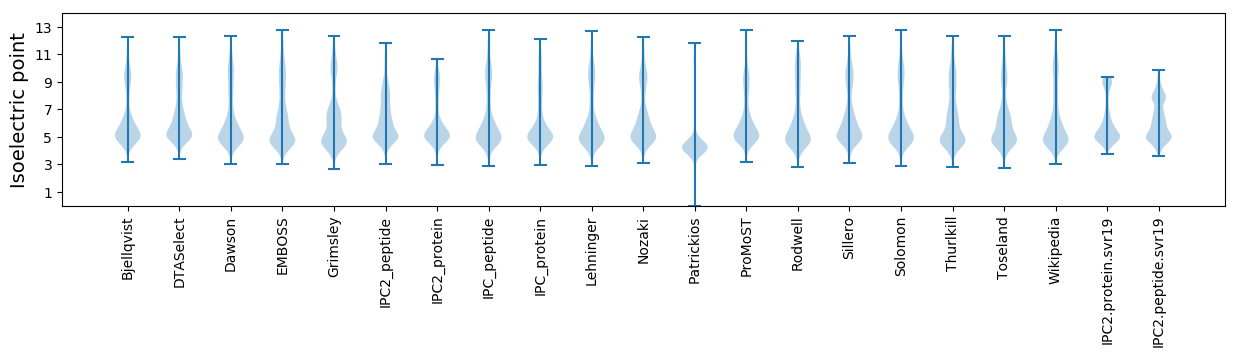
* You can choose from 21 different methods for calculating isoelectric point
Summary statistics related to proteome-wise predictions
Protein with the lowest isoelectric point:
>tr|U2G3S5|U2G3S5_9GAMM Histidine kinase OS=Salinisphaera shabanensis E1L3A OX=1033802 GN=SSPSH_000110 PE=4 SV=1
MM1 pKa = 7.72VDD3 pKa = 3.22RR4 pKa = 11.84DD5 pKa = 3.93YY6 pKa = 11.64FGTDD10 pKa = 2.78SEE12 pKa = 4.26AQEE15 pKa = 4.69LIGNAILQYY24 pKa = 11.45DD25 pKa = 3.89MSFDD29 pKa = 4.81HH30 pKa = 7.14IDD32 pKa = 3.29SSTLAGVEE40 pKa = 4.01YY41 pKa = 10.5RR42 pKa = 11.84DD43 pKa = 4.04ASSDD47 pKa = 3.5DD48 pKa = 3.26SSFYY52 pKa = 11.38GDD54 pKa = 4.31AAPIDD59 pKa = 4.12IANPDD64 pKa = 3.54YY65 pKa = 11.37SGAPSSLNVYY75 pKa = 8.72MGNDD79 pKa = 2.87QDD81 pKa = 5.04YY82 pKa = 7.24EE83 pKa = 4.5TKK85 pKa = 10.64SVFLTQNLSFYY96 pKa = 11.31DD97 pKa = 3.78RR98 pKa = 11.84FVVTAGVRR106 pKa = 11.84NDD108 pKa = 3.62SLDD111 pKa = 3.63LSSTDD116 pKa = 2.83ITGVTEE122 pKa = 4.25SDD124 pKa = 3.85DD125 pKa = 3.82FSEE128 pKa = 4.46TSVRR132 pKa = 11.84GALTYY137 pKa = 10.21IVNDD141 pKa = 4.19EE142 pKa = 3.77ISTYY146 pKa = 9.7ISQVEE151 pKa = 4.67SVAPPSIGVKK161 pKa = 9.17PEE163 pKa = 3.66RR164 pKa = 11.84GEE166 pKa = 3.95QYY168 pKa = 9.44TRR170 pKa = 11.84RR171 pKa = 11.84PAA173 pKa = 3.54
MM1 pKa = 7.72VDD3 pKa = 3.22RR4 pKa = 11.84DD5 pKa = 3.93YY6 pKa = 11.64FGTDD10 pKa = 2.78SEE12 pKa = 4.26AQEE15 pKa = 4.69LIGNAILQYY24 pKa = 11.45DD25 pKa = 3.89MSFDD29 pKa = 4.81HH30 pKa = 7.14IDD32 pKa = 3.29SSTLAGVEE40 pKa = 4.01YY41 pKa = 10.5RR42 pKa = 11.84DD43 pKa = 4.04ASSDD47 pKa = 3.5DD48 pKa = 3.26SSFYY52 pKa = 11.38GDD54 pKa = 4.31AAPIDD59 pKa = 4.12IANPDD64 pKa = 3.54YY65 pKa = 11.37SGAPSSLNVYY75 pKa = 8.72MGNDD79 pKa = 2.87QDD81 pKa = 5.04YY82 pKa = 7.24EE83 pKa = 4.5TKK85 pKa = 10.64SVFLTQNLSFYY96 pKa = 11.31DD97 pKa = 3.78RR98 pKa = 11.84FVVTAGVRR106 pKa = 11.84NDD108 pKa = 3.62SLDD111 pKa = 3.63LSSTDD116 pKa = 2.83ITGVTEE122 pKa = 4.25SDD124 pKa = 3.85DD125 pKa = 3.82FSEE128 pKa = 4.46TSVRR132 pKa = 11.84GALTYY137 pKa = 10.21IVNDD141 pKa = 4.19EE142 pKa = 3.77ISTYY146 pKa = 9.7ISQVEE151 pKa = 4.67SVAPPSIGVKK161 pKa = 9.17PEE163 pKa = 3.66RR164 pKa = 11.84GEE166 pKa = 3.95QYY168 pKa = 9.44TRR170 pKa = 11.84RR171 pKa = 11.84PAA173 pKa = 3.54
Molecular weight: 18.97 kDa
Isoelectric point according different methods:
Protein with the highest isoelectric point:
>tr|U2FWQ3|U2FWQ3_9GAMM 30S ribosomal protein S15 OS=Salinisphaera shabanensis E1L3A OX=1033802 GN=rpsO PE=3 SV=1
MM1 pKa = 8.09RR2 pKa = 11.84STLRR6 pKa = 11.84HH7 pKa = 5.25AVAIALFICAPGVAGANPSDD27 pKa = 3.5QSGPARR33 pKa = 11.84VANAAGEE40 pKa = 4.18YY41 pKa = 10.55LVFSDD46 pKa = 6.03ALTADD51 pKa = 4.05CMLHH55 pKa = 6.49RR56 pKa = 11.84GRR58 pKa = 11.84SRR60 pKa = 11.84RR61 pKa = 11.84IANTHH66 pKa = 4.78PTRR69 pKa = 11.84AIRR72 pKa = 11.84VVLIAYY78 pKa = 7.24TGKK81 pKa = 8.2TRR83 pKa = 11.84AQGDD87 pKa = 4.02SEE89 pKa = 5.46FILDD93 pKa = 4.42PKK95 pKa = 10.2TEE97 pKa = 4.35PKK99 pKa = 10.39PLGCDD104 pKa = 3.07SVSGLARR111 pKa = 11.84RR112 pKa = 11.84WEE114 pKa = 4.03IVHH117 pKa = 6.59ARR119 pKa = 11.84FVSPARR125 pKa = 11.84RR126 pKa = 3.34
MM1 pKa = 8.09RR2 pKa = 11.84STLRR6 pKa = 11.84HH7 pKa = 5.25AVAIALFICAPGVAGANPSDD27 pKa = 3.5QSGPARR33 pKa = 11.84VANAAGEE40 pKa = 4.18YY41 pKa = 10.55LVFSDD46 pKa = 6.03ALTADD51 pKa = 4.05CMLHH55 pKa = 6.49RR56 pKa = 11.84GRR58 pKa = 11.84SRR60 pKa = 11.84RR61 pKa = 11.84IANTHH66 pKa = 4.78PTRR69 pKa = 11.84AIRR72 pKa = 11.84VVLIAYY78 pKa = 7.24TGKK81 pKa = 8.2TRR83 pKa = 11.84AQGDD87 pKa = 4.02SEE89 pKa = 5.46FILDD93 pKa = 4.42PKK95 pKa = 10.2TEE97 pKa = 4.35PKK99 pKa = 10.39PLGCDD104 pKa = 3.07SVSGLARR111 pKa = 11.84RR112 pKa = 11.84WEE114 pKa = 4.03IVHH117 pKa = 6.59ARR119 pKa = 11.84FVSPARR125 pKa = 11.84RR126 pKa = 3.34
Molecular weight: 13.61 kDa
Isoelectric point according different methods:
Peptides (in silico digests for buttom-up proteomics)
Below you can find in silico digests of the whole proteome with Trypsin, Chymotrypsin, Trypsin+LysC, LysN, ArgC proteases suitable for different mass spec machines.| Try ESI |
 |
|---|
| ChTry ESI |
|
|---|
| ArgC ESI |
|
|---|
| LysN ESI |
|
|---|
| TryLysC ESI |
|
|---|
| Try MALDI |
|
|---|
| ChTry MALDI |
|
|---|
| ArgC MALDI |
|
|---|
| LysN MALDI |
|
|---|
| TryLysC MALDI |
|
|---|
| Try LTQ |
|
|---|
| ChTry LTQ |
|
|---|
| ArgC LTQ |
|
|---|
| LysN LTQ |
|
|---|
| TryLysC LTQ |
|
|---|
| Try MSlow |
|
|---|
| ChTry MSlow |
|
|---|
| ArgC MSlow |
|
|---|
| LysN MSlow |
|
|---|
| TryLysC MSlow |
|
|---|
| Try MShigh |
|
|---|
| ChTry MShigh |
|
|---|
| ArgC MShigh |
|
|---|
| LysN MShigh |
|
|---|
| TryLysC MShigh |
|
|---|
General Statistics
Number of major isoforms |
Number of additional isoforms |
Number of all proteins |
Number of amino acids |
Min. Seq. Length |
Max. Seq. Length |
Avg. Seq. Length |
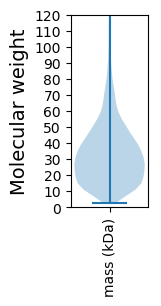
Avg. Mol. Weight |
|---|---|---|---|---|---|---|---|
0 |
1120061 |
27 |
3756 |
317.8 |
34.71 |
Amino acid frequency
Ala |
Cys |
Asp |
Glu |
Phe |
Gly |
His |
Ile |
Lys |
Leu |
|---|---|---|---|---|---|---|---|---|---|
12.352 ± 0.055 | 0.942 ± 0.014 |
6.526 ± 0.035 | 5.76 ± 0.037 |
3.543 ± 0.028 | 8.1 ± 0.034 |
2.285 ± 0.024 | 4.99 ± 0.029 |
2.7 ± 0.032 | 10.081 ± 0.046 |
Met |
Asn |
Gln |
Pro |
Arg |
Ser |
Thr |
Val |
Trp |
Tyr |
|---|---|---|---|---|---|---|---|---|---|
2.415 ± 0.021 | 2.857 ± 0.023 |
4.686 ± 0.026 | 3.5 ± 0.023 |
7.344 ± 0.042 | 5.383 ± 0.028 |
5.253 ± 0.027 | 7.322 ± 0.032 |
1.365 ± 0.017 | 2.595 ± 0.021 |
Most of the basic statistics you can see at this page can be downloaded from this CSV file
See this proteome in:

Proteome-pI is available under Creative Commons Attribution-NoDerivs license, for more details see here
| Reference: Kozlowski LP. Proteome-pI 2.0: Proteome Isoelectric Point Database Update. Nucleic Acids Res. 2021, doi: 10.1093/nar/gkab944 | Contact: Lukasz P. Kozlowski |