Streptococcus phage P9853
Taxonomy: Viruses; Duplodnaviria; Heunggongvirae; Uroviricota; Caudoviricetes; Caudovirales; Siphoviridae; Brussowvirus; unclassified Brussowvirus
Average proteome isoelectric point is 6.89
Get precalculated fractions of proteins
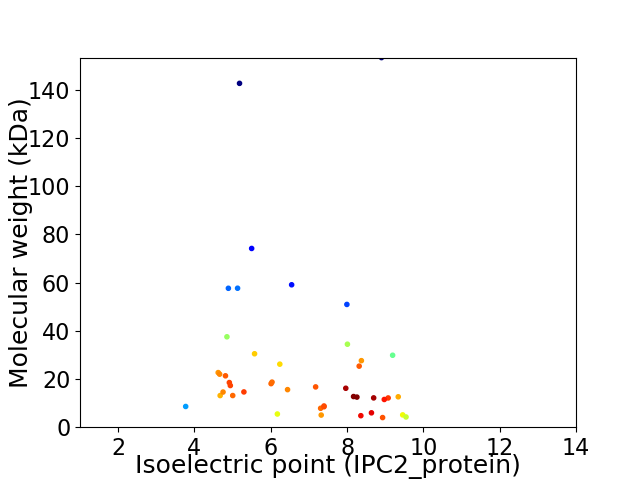
Virtual 2D-PAGE plot for 45 proteins (isoelectric point calculated using IPC2_protein)
Get csv file with sequences according to given criteria:
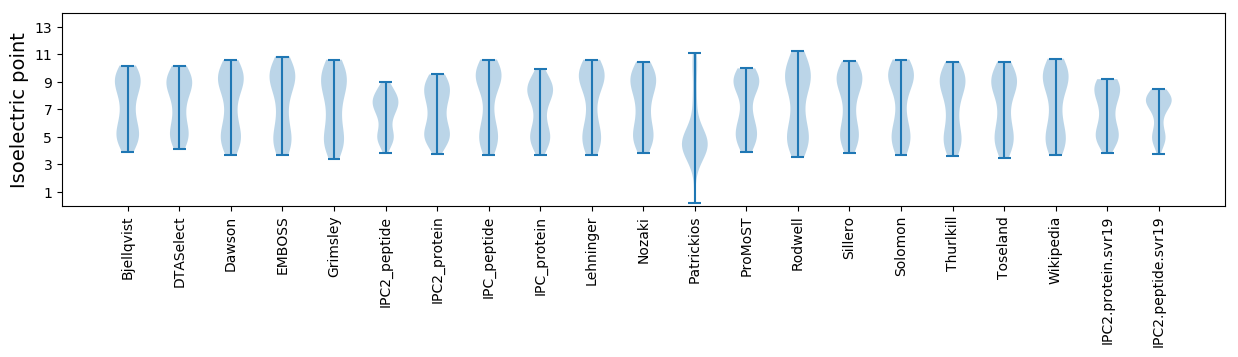
* You can choose from 21 different methods for calculating isoelectric point
Summary statistics related to proteome-wise predictions
Protein with the lowest isoelectric point:
>tr|A0A286QRR3|A0A286QRR3_9CAUD Antireceptor OS=Streptococcus phage P9853 OX=1971445 GN=P9853_19 PE=4 SV=1
MM1 pKa = 7.13VNWVDD6 pKa = 4.44ANGNDD11 pKa = 4.02LSDD14 pKa = 4.99GADD17 pKa = 3.16QDD19 pKa = 4.45FKK21 pKa = 11.75AGMFFSFAGDD31 pKa = 3.45EE32 pKa = 4.32VNITDD37 pKa = 3.77TGEE40 pKa = 3.65GGYY43 pKa = 10.61YY44 pKa = 9.76GGYY47 pKa = 8.0YY48 pKa = 9.41YY49 pKa = 10.76RR50 pKa = 11.84RR51 pKa = 11.84FEE53 pKa = 4.06FGQFGTVWLSCWNKK67 pKa = 10.66DD68 pKa = 3.89DD69 pKa = 5.14LVNYY73 pKa = 7.38YY74 pKa = 8.26QQ75 pKa = 4.22
MM1 pKa = 7.13VNWVDD6 pKa = 4.44ANGNDD11 pKa = 4.02LSDD14 pKa = 4.99GADD17 pKa = 3.16QDD19 pKa = 4.45FKK21 pKa = 11.75AGMFFSFAGDD31 pKa = 3.45EE32 pKa = 4.32VNITDD37 pKa = 3.77TGEE40 pKa = 3.65GGYY43 pKa = 10.61YY44 pKa = 9.76GGYY47 pKa = 8.0YY48 pKa = 9.41YY49 pKa = 10.76RR50 pKa = 11.84RR51 pKa = 11.84FEE53 pKa = 4.06FGQFGTVWLSCWNKK67 pKa = 10.66DD68 pKa = 3.89DD69 pKa = 5.14LVNYY73 pKa = 7.38YY74 pKa = 8.26QQ75 pKa = 4.22
Molecular weight: 8.6 kDa
Isoelectric point according different methods:
Protein with the highest isoelectric point:
>tr|A0A286QT79|A0A286QT79_9CAUD Uncharacterized protein OS=Streptococcus phage P9853 OX=1971445 GN=P9853_44 PE=4 SV=1
MM1 pKa = 7.25LTFIKK6 pKa = 10.16CLQLFLPKK14 pKa = 10.17KK15 pKa = 7.71QTLRR19 pKa = 11.84GYY21 pKa = 9.2EE22 pKa = 4.1KK23 pKa = 10.16IRR25 pKa = 11.84VFVLGSFITPII36 pKa = 3.64
MM1 pKa = 7.25LTFIKK6 pKa = 10.16CLQLFLPKK14 pKa = 10.17KK15 pKa = 7.71QTLRR19 pKa = 11.84GYY21 pKa = 9.2EE22 pKa = 4.1KK23 pKa = 10.16IRR25 pKa = 11.84VFVLGSFITPII36 pKa = 3.64
Molecular weight: 4.24 kDa
Isoelectric point according different methods:
Peptides (in silico digests for buttom-up proteomics)
Below you can find in silico digests of the whole proteome with Trypsin, Chymotrypsin, Trypsin+LysC, LysN, ArgC proteases suitable for different mass spec machines.| Try ESI |
 |
|---|
| ChTry ESI |
|
|---|
| ArgC ESI |
|
|---|
| LysN ESI |
|
|---|
| TryLysC ESI |
|
|---|
| Try MALDI |
|
|---|
| ChTry MALDI |
|
|---|
| ArgC MALDI |
|
|---|
| LysN MALDI |
|
|---|
| TryLysC MALDI |
|
|---|
| Try LTQ |
|
|---|
| ChTry LTQ |
|
|---|
| ArgC LTQ |
|
|---|
| LysN LTQ |
|
|---|
| TryLysC LTQ |
|
|---|
| Try MSlow |
|
|---|
| ChTry MSlow |
|
|---|
| ArgC MSlow |
|
|---|
| LysN MSlow |
|
|---|
| TryLysC MSlow |
|
|---|
| Try MShigh |
|
|---|
| ChTry MShigh |
|
|---|
| ArgC MShigh |
|
|---|
| LysN MShigh |
|
|---|
| TryLysC MShigh |
|
|---|
General Statistics
Number of major isoforms |
Number of additional isoforms |
Number of all proteins |
Number of amino acids |
Min. Seq. Length |
Max. Seq. Length |
Avg. Seq. Length |
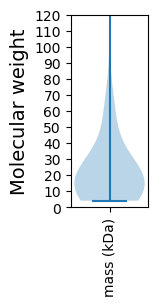
Avg. Mol. Weight |
|---|---|---|---|---|---|---|---|
0 |
10676 |
35 |
1517 |
237.2 |
26.48 |
Amino acid frequency
Ala |
Cys |
Asp |
Glu |
Phe |
Gly |
His |
Ile |
Lys |
Leu |
|---|---|---|---|---|---|---|---|---|---|
7.746 ± 1.322 | 0.543 ± 0.146 |
6.07 ± 0.479 | 6.248 ± 0.722 |
4.131 ± 0.161 | 7.1 ± 0.516 |
1.208 ± 0.171 | 6.847 ± 0.414 |
7.746 ± 0.658 | 7.559 ± 0.41 |
Met |
Asn |
Gln |
Pro |
Arg |
Ser |
Thr |
Val |
Trp |
Tyr |
|---|---|---|---|---|---|---|---|---|---|
2.501 ± 0.317 | 5.62 ± 0.438 |
2.96 ± 0.278 | 3.756 ± 0.246 |
4.253 ± 0.39 | 7.119 ± 0.658 |
6.679 ± 0.349 | 6.725 ± 0.23 |
1.218 ± 0.21 | 3.972 ± 0.499 |
Most of the basic statistics you can see at this page can be downloaded from this CSV file
See this proteome in:

Proteome-pI is available under Creative Commons Attribution-NoDerivs license, for more details see here
| Reference: Kozlowski LP. Proteome-pI 2.0: Proteome Isoelectric Point Database Update. Nucleic Acids Res. 2021, doi: 10.1093/nar/gkab944 | Contact: Lukasz P. Kozlowski |