Desulfovibrio sp. FSS-1
Taxonomy: cellular organisms; Bacteria; Proteobacteria; delta/epsilon subdivisions; Deltaproteobacteria; Desulfovibrionales; Desulfovibrionaceae; Desulfovibrio; unclassified Desulfovibrio
Average proteome isoelectric point is 6.74
Get precalculated fractions of proteins
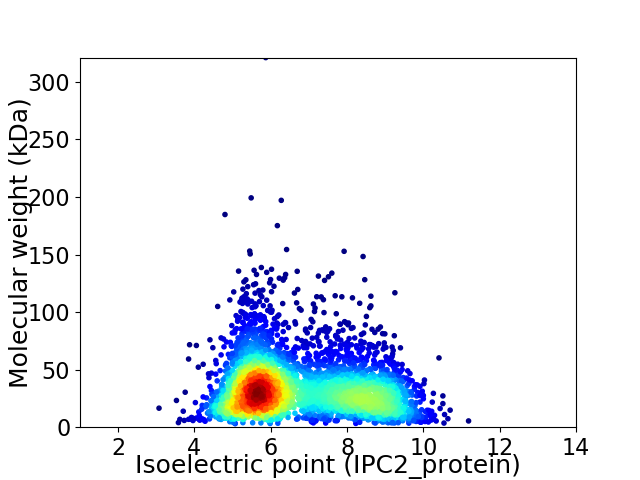
Virtual 2D-PAGE plot for 3975 proteins (isoelectric point calculated using IPC2_protein)
Get csv file with sequences according to given criteria:
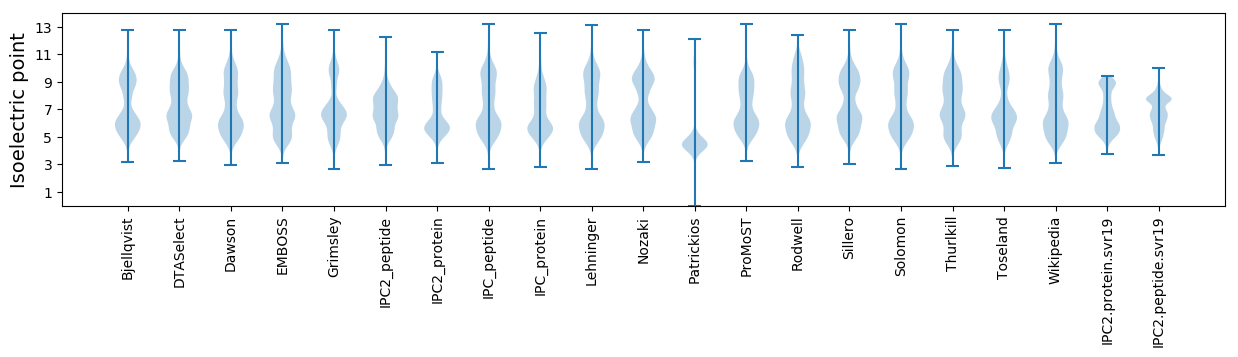
* You can choose from 21 different methods for calculating isoelectric point
Summary statistics related to proteome-wise predictions
Protein with the lowest isoelectric point:
>tr|A0A6V8LS19|A0A6V8LS19_9DELT Uncharacterized protein OS=Desulfovibrio sp. FSS-1 OX=2730080 GN=NNJEOMEG_00411 PE=4 SV=1
MM1 pKa = 7.53ALDD4 pKa = 4.08EE5 pKa = 5.41PKK7 pKa = 10.96DD8 pKa = 3.65SDD10 pKa = 5.35DD11 pKa = 3.59VFEE14 pKa = 4.3TDD16 pKa = 3.86GYY18 pKa = 11.42SFIIDD23 pKa = 3.62KK24 pKa = 10.82EE25 pKa = 4.35LMGKK29 pKa = 8.61AQPVTVDD36 pKa = 3.2LSYY39 pKa = 10.83MGFQVHH45 pKa = 6.62SSLEE49 pKa = 4.12LGGGGCGSSCSSGSCGQQ66 pKa = 3.25
MM1 pKa = 7.53ALDD4 pKa = 4.08EE5 pKa = 5.41PKK7 pKa = 10.96DD8 pKa = 3.65SDD10 pKa = 5.35DD11 pKa = 3.59VFEE14 pKa = 4.3TDD16 pKa = 3.86GYY18 pKa = 11.42SFIIDD23 pKa = 3.62KK24 pKa = 10.82EE25 pKa = 4.35LMGKK29 pKa = 8.61AQPVTVDD36 pKa = 3.2LSYY39 pKa = 10.83MGFQVHH45 pKa = 6.62SSLEE49 pKa = 4.12LGGGGCGSSCSSGSCGQQ66 pKa = 3.25
Molecular weight: 6.89 kDa
Isoelectric point according different methods:
Protein with the highest isoelectric point:
>tr|A0A6V8LKG8|A0A6V8LKG8_9DELT Sensory transduction protein LytR OS=Desulfovibrio sp. FSS-1 OX=2730080 GN=lytR_1 PE=4 SV=1
MM1 pKa = 7.74SKK3 pKa = 8.96RR4 pKa = 11.84TYY6 pKa = 9.84QPHH9 pKa = 4.42NTRR12 pKa = 11.84RR13 pKa = 11.84KK14 pKa = 7.56RR15 pKa = 11.84THH17 pKa = 5.83GFLVRR22 pKa = 11.84SRR24 pKa = 11.84TKK26 pKa = 10.16NGRR29 pKa = 11.84AIIRR33 pKa = 11.84RR34 pKa = 11.84RR35 pKa = 11.84RR36 pKa = 11.84AKK38 pKa = 9.67GRR40 pKa = 11.84KK41 pKa = 8.98RR42 pKa = 11.84LGAA45 pKa = 3.98
MM1 pKa = 7.74SKK3 pKa = 8.96RR4 pKa = 11.84TYY6 pKa = 9.84QPHH9 pKa = 4.42NTRR12 pKa = 11.84RR13 pKa = 11.84KK14 pKa = 7.56RR15 pKa = 11.84THH17 pKa = 5.83GFLVRR22 pKa = 11.84SRR24 pKa = 11.84TKK26 pKa = 10.16NGRR29 pKa = 11.84AIIRR33 pKa = 11.84RR34 pKa = 11.84RR35 pKa = 11.84RR36 pKa = 11.84AKK38 pKa = 9.67GRR40 pKa = 11.84KK41 pKa = 8.98RR42 pKa = 11.84LGAA45 pKa = 3.98
Molecular weight: 5.43 kDa
Isoelectric point according different methods:
Peptides (in silico digests for buttom-up proteomics)
Below you can find in silico digests of the whole proteome with Trypsin, Chymotrypsin, Trypsin+LysC, LysN, ArgC proteases suitable for different mass spec machines.| Try ESI |
 |
|---|
| ChTry ESI |
|
|---|
| ArgC ESI |
|
|---|
| LysN ESI |
|
|---|
| TryLysC ESI |
|
|---|
| Try MALDI |
|
|---|
| ChTry MALDI |
|
|---|
| ArgC MALDI |
|
|---|
| LysN MALDI |
|
|---|
| TryLysC MALDI |
|
|---|
| Try LTQ |
|
|---|
| ChTry LTQ |
|
|---|
| ArgC LTQ |
|
|---|
| LysN LTQ |
|
|---|
| TryLysC LTQ |
|
|---|
| Try MSlow |
|
|---|
| ChTry MSlow |
|
|---|
| ArgC MSlow |
|
|---|
| LysN MSlow |
|
|---|
| TryLysC MSlow |
|
|---|
| Try MShigh |
|
|---|
| ChTry MShigh |
|
|---|
| ArgC MShigh |
|
|---|
| LysN MShigh |
|
|---|
| TryLysC MShigh |
|
|---|
General Statistics
Number of major isoforms |
Number of additional isoforms |
Number of all proteins |
Number of amino acids |
Min. Seq. Length |
Max. Seq. Length |
Avg. Seq. Length |
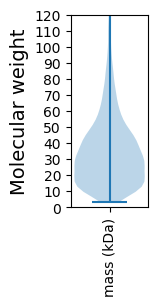
Avg. Mol. Weight |
|---|---|---|---|---|---|---|---|
0 |
1316110 |
29 |
2874 |
331.1 |
36.06 |
Amino acid frequency
Ala |
Cys |
Asp |
Glu |
Phe |
Gly |
His |
Ile |
Lys |
Leu |
|---|---|---|---|---|---|---|---|---|---|
12.254 ± 0.061 | 1.294 ± 0.015 |
5.235 ± 0.029 | 6.147 ± 0.038 |
3.846 ± 0.024 | 8.536 ± 0.037 |
2.063 ± 0.021 | 3.842 ± 0.037 |
3.697 ± 0.038 | 11.445 ± 0.049 |
Met |
Asn |
Gln |
Pro |
Arg |
Ser |
Thr |
Val |
Trp |
Tyr |
|---|---|---|---|---|---|---|---|---|---|
2.485 ± 0.017 | 2.402 ± 0.023 |
5.504 ± 0.037 | 3.215 ± 0.027 |
7.328 ± 0.044 | 5.225 ± 0.03 |
4.567 ± 0.026 | 7.384 ± 0.028 |
1.266 ± 0.017 | 2.265 ± 0.021 |
Most of the basic statistics you can see at this page can be downloaded from this CSV file
See this proteome in:

Proteome-pI is available under Creative Commons Attribution-NoDerivs license, for more details see here
| Reference: Kozlowski LP. Proteome-pI 2.0: Proteome Isoelectric Point Database Update. Nucleic Acids Res. 2021, doi: 10.1093/nar/gkab944 | Contact: Lukasz P. Kozlowski |