Alkalibacter saccharofermentans DSM 14828
Taxonomy: cellular organisms; Bacteria; Terrabacteria group; Firmicutes; Clostridia; Eubacteriales; Eubacteriaceae; Alkalibacter; Alkalibacter saccharofermentans
Average proteome isoelectric point is 6.17
Get precalculated fractions of proteins
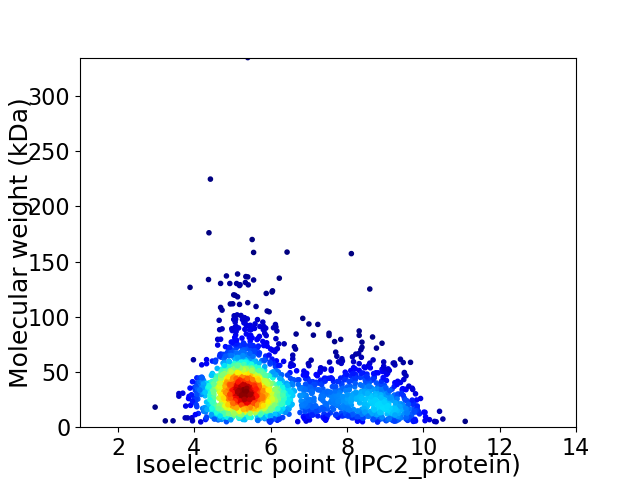
Virtual 2D-PAGE plot for 2181 proteins (isoelectric point calculated using IPC2_protein)
Get csv file with sequences according to given criteria:
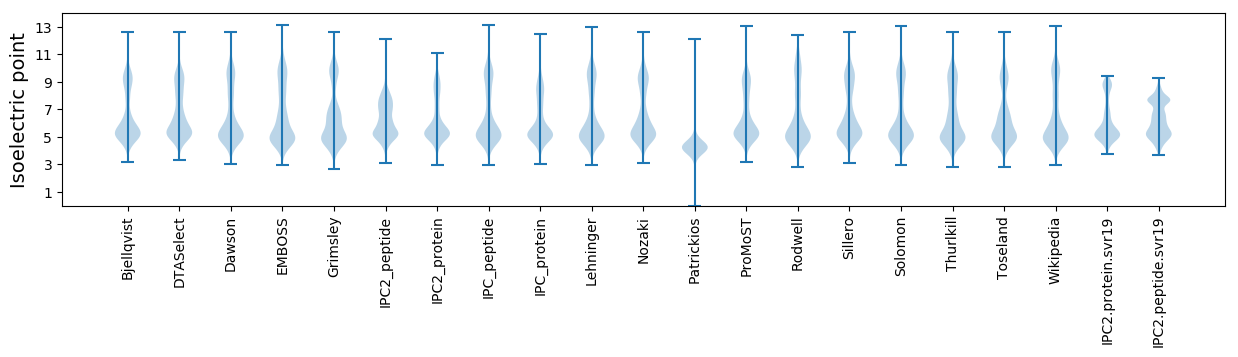
* You can choose from 21 different methods for calculating isoelectric point
Summary statistics related to proteome-wise predictions
Protein with the lowest isoelectric point:
>tr|A0A1M4WK38|A0A1M4WK38_9FIRM MinD superfamily P-loop ATPase contains an inserted ferredoxin domain OS=Alkalibacter saccharofermentans DSM 14828 OX=1120975 GN=SAMN02746064_01266 PE=4 SV=1
MM1 pKa = 7.45KK2 pKa = 9.62MKK4 pKa = 10.51KK5 pKa = 10.16FLVFLLAALLILSLAACGGNGDD27 pKa = 4.17TNGSQVTDD35 pKa = 3.38NGEE38 pKa = 3.98GSSEE42 pKa = 4.2SEE44 pKa = 3.57EE45 pKa = 5.22DD46 pKa = 3.1ITFEE50 pKa = 5.46DD51 pKa = 3.7SLKK54 pKa = 11.24AEE56 pKa = 5.23GIYY59 pKa = 10.41EE60 pKa = 3.96NYY62 pKa = 8.82YY63 pKa = 10.72FEE65 pKa = 4.92MEE67 pKa = 4.35VNVNGEE73 pKa = 4.47DD74 pKa = 4.08FPTSQLWFLGGDD86 pKa = 3.42MKK88 pKa = 11.26FEE90 pKa = 4.31NQDD93 pKa = 2.9QAIFIKK99 pKa = 10.51PSEE102 pKa = 4.26EE103 pKa = 3.6QMGIYY108 pKa = 9.39TKK110 pKa = 9.45EE111 pKa = 4.08TNQLVLMPISEE122 pKa = 4.45NEE124 pKa = 3.81DD125 pKa = 3.82FYY127 pKa = 11.28TPFIAADD134 pKa = 4.03EE135 pKa = 4.34IEE137 pKa = 4.24EE138 pKa = 4.02EE139 pKa = 4.6VYY141 pKa = 10.88EE142 pKa = 4.76GILYY146 pKa = 10.19KK147 pKa = 10.84GSEE150 pKa = 4.22TLDD153 pKa = 3.43GKK155 pKa = 9.05TVDD158 pKa = 3.44VFEE161 pKa = 4.54YY162 pKa = 11.17DD163 pKa = 4.29AMDD166 pKa = 3.87VYY168 pKa = 11.42AKK170 pKa = 10.57YY171 pKa = 10.71YY172 pKa = 8.63IWRR175 pKa = 11.84DD176 pKa = 3.02TGIIVKK182 pKa = 9.06MIVHH186 pKa = 5.96SDD188 pKa = 3.45EE189 pKa = 4.65YY190 pKa = 10.34EE191 pKa = 3.82SEE193 pKa = 4.63YY194 pKa = 10.8YY195 pKa = 9.39FRR197 pKa = 11.84NMRR200 pKa = 11.84VNEE203 pKa = 4.0LTADD207 pKa = 3.76DD208 pKa = 4.24LAYY211 pKa = 10.13PEE213 pKa = 5.08DD214 pKa = 4.42AEE216 pKa = 4.26IMDD219 pKa = 3.51MSEE222 pKa = 4.87FLVQQ226 pKa = 3.89
MM1 pKa = 7.45KK2 pKa = 9.62MKK4 pKa = 10.51KK5 pKa = 10.16FLVFLLAALLILSLAACGGNGDD27 pKa = 4.17TNGSQVTDD35 pKa = 3.38NGEE38 pKa = 3.98GSSEE42 pKa = 4.2SEE44 pKa = 3.57EE45 pKa = 5.22DD46 pKa = 3.1ITFEE50 pKa = 5.46DD51 pKa = 3.7SLKK54 pKa = 11.24AEE56 pKa = 5.23GIYY59 pKa = 10.41EE60 pKa = 3.96NYY62 pKa = 8.82YY63 pKa = 10.72FEE65 pKa = 4.92MEE67 pKa = 4.35VNVNGEE73 pKa = 4.47DD74 pKa = 4.08FPTSQLWFLGGDD86 pKa = 3.42MKK88 pKa = 11.26FEE90 pKa = 4.31NQDD93 pKa = 2.9QAIFIKK99 pKa = 10.51PSEE102 pKa = 4.26EE103 pKa = 3.6QMGIYY108 pKa = 9.39TKK110 pKa = 9.45EE111 pKa = 4.08TNQLVLMPISEE122 pKa = 4.45NEE124 pKa = 3.81DD125 pKa = 3.82FYY127 pKa = 11.28TPFIAADD134 pKa = 4.03EE135 pKa = 4.34IEE137 pKa = 4.24EE138 pKa = 4.02EE139 pKa = 4.6VYY141 pKa = 10.88EE142 pKa = 4.76GILYY146 pKa = 10.19KK147 pKa = 10.84GSEE150 pKa = 4.22TLDD153 pKa = 3.43GKK155 pKa = 9.05TVDD158 pKa = 3.44VFEE161 pKa = 4.54YY162 pKa = 11.17DD163 pKa = 4.29AMDD166 pKa = 3.87VYY168 pKa = 11.42AKK170 pKa = 10.57YY171 pKa = 10.71YY172 pKa = 8.63IWRR175 pKa = 11.84DD176 pKa = 3.02TGIIVKK182 pKa = 9.06MIVHH186 pKa = 5.96SDD188 pKa = 3.45EE189 pKa = 4.65YY190 pKa = 10.34EE191 pKa = 3.82SEE193 pKa = 4.63YY194 pKa = 10.8YY195 pKa = 9.39FRR197 pKa = 11.84NMRR200 pKa = 11.84VNEE203 pKa = 4.0LTADD207 pKa = 3.76DD208 pKa = 4.24LAYY211 pKa = 10.13PEE213 pKa = 5.08DD214 pKa = 4.42AEE216 pKa = 4.26IMDD219 pKa = 3.51MSEE222 pKa = 4.87FLVQQ226 pKa = 3.89
Molecular weight: 25.94 kDa
Isoelectric point according different methods:
Protein with the highest isoelectric point:
>tr|A0A1M4T900|A0A1M4T900_9FIRM EamA-like transporter family protein OS=Alkalibacter saccharofermentans DSM 14828 OX=1120975 GN=SAMN02746064_00419 PE=3 SV=1
MM1 pKa = 7.6KK2 pKa = 8.52MTYY5 pKa = 8.4QPKK8 pKa = 8.68VRR10 pKa = 11.84QRR12 pKa = 11.84SKK14 pKa = 9.44VHH16 pKa = 6.44GFRR19 pKa = 11.84QRR21 pKa = 11.84MKK23 pKa = 9.4SASGRR28 pKa = 11.84KK29 pKa = 8.73VLSNRR34 pKa = 11.84RR35 pKa = 11.84RR36 pKa = 11.84KK37 pKa = 8.97GRR39 pKa = 11.84KK40 pKa = 8.84RR41 pKa = 11.84LSAA44 pKa = 3.96
MM1 pKa = 7.6KK2 pKa = 8.52MTYY5 pKa = 8.4QPKK8 pKa = 8.68VRR10 pKa = 11.84QRR12 pKa = 11.84SKK14 pKa = 9.44VHH16 pKa = 6.44GFRR19 pKa = 11.84QRR21 pKa = 11.84MKK23 pKa = 9.4SASGRR28 pKa = 11.84KK29 pKa = 8.73VLSNRR34 pKa = 11.84RR35 pKa = 11.84RR36 pKa = 11.84KK37 pKa = 8.97GRR39 pKa = 11.84KK40 pKa = 8.84RR41 pKa = 11.84LSAA44 pKa = 3.96
Molecular weight: 5.29 kDa
Isoelectric point according different methods:
Peptides (in silico digests for buttom-up proteomics)
Below you can find in silico digests of the whole proteome with Trypsin, Chymotrypsin, Trypsin+LysC, LysN, ArgC proteases suitable for different mass spec machines.| Try ESI |
 |
|---|
| ChTry ESI |
|
|---|
| ArgC ESI |
|
|---|
| LysN ESI |
|
|---|
| TryLysC ESI |
|
|---|
| Try MALDI |
|
|---|
| ChTry MALDI |
|
|---|
| ArgC MALDI |
|
|---|
| LysN MALDI |
|
|---|
| TryLysC MALDI |
|
|---|
| Try LTQ |
|
|---|
| ChTry LTQ |
|
|---|
| ArgC LTQ |
|
|---|
| LysN LTQ |
|
|---|
| TryLysC LTQ |
|
|---|
| Try MSlow |
|
|---|
| ChTry MSlow |
|
|---|
| ArgC MSlow |
|
|---|
| LysN MSlow |
|
|---|
| TryLysC MSlow |
|
|---|
| Try MShigh |
|
|---|
| ChTry MShigh |
|
|---|
| ArgC MShigh |
|
|---|
| LysN MShigh |
|
|---|
| TryLysC MShigh |
|
|---|
General Statistics
Number of major isoforms |
Number of additional isoforms |
Number of all proteins |
Number of amino acids |
Min. Seq. Length |
Max. Seq. Length |
Avg. Seq. Length |
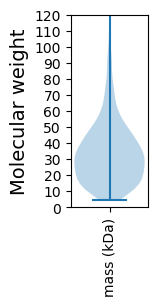
Avg. Mol. Weight |
|---|---|---|---|---|---|---|---|
0 |
692899 |
40 |
2944 |
317.7 |
35.58 |
Amino acid frequency
Ala |
Cys |
Asp |
Glu |
Phe |
Gly |
His |
Ile |
Lys |
Leu |
|---|---|---|---|---|---|---|---|---|---|
6.627 ± 0.047 | 1.029 ± 0.02 |
5.938 ± 0.047 | 7.559 ± 0.055 |
4.271 ± 0.04 | 7.279 ± 0.049 |
1.657 ± 0.022 | 8.735 ± 0.047 |
7.862 ± 0.052 | 9.124 ± 0.06 |
Met |
Asn |
Gln |
Pro |
Arg |
Ser |
Thr |
Val |
Trp |
Tyr |
|---|---|---|---|---|---|---|---|---|---|
3.052 ± 0.028 | 4.723 ± 0.038 |
3.216 ± 0.029 | 2.514 ± 0.023 |
3.953 ± 0.031 | 6.188 ± 0.037 |
4.845 ± 0.037 | 6.944 ± 0.041 |
0.736 ± 0.017 | 3.747 ± 0.033 |
Most of the basic statistics you can see at this page can be downloaded from this CSV file
See this proteome in:

Proteome-pI is available under Creative Commons Attribution-NoDerivs license, for more details see here
| Reference: Kozlowski LP. Proteome-pI 2.0: Proteome Isoelectric Point Database Update. Nucleic Acids Res. 2021, doi: 10.1093/nar/gkab944 | Contact: Lukasz P. Kozlowski |