Mycobacterium phage Journey13
Taxonomy: Viruses; Duplodnaviria; Heunggongvirae; Uroviricota; Caudoviricetes; Caudovirales; Siphoviridae; Fromanvirus; unclassified Fromanvirus
Average proteome isoelectric point is 6.04
Get precalculated fractions of proteins
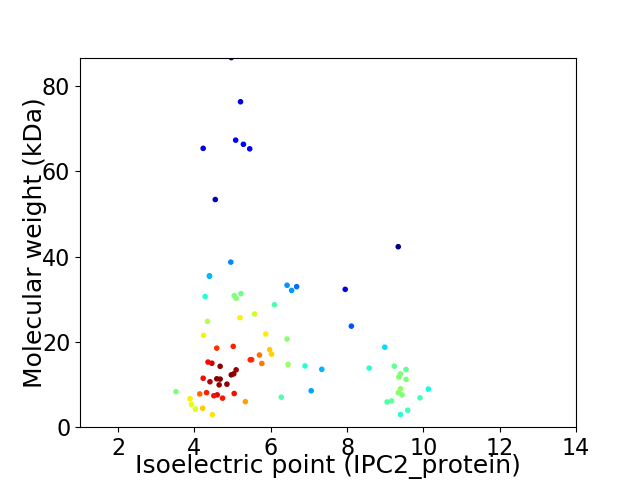
Virtual 2D-PAGE plot for 81 proteins (isoelectric point calculated using IPC2_protein)
Get csv file with sequences according to given criteria:
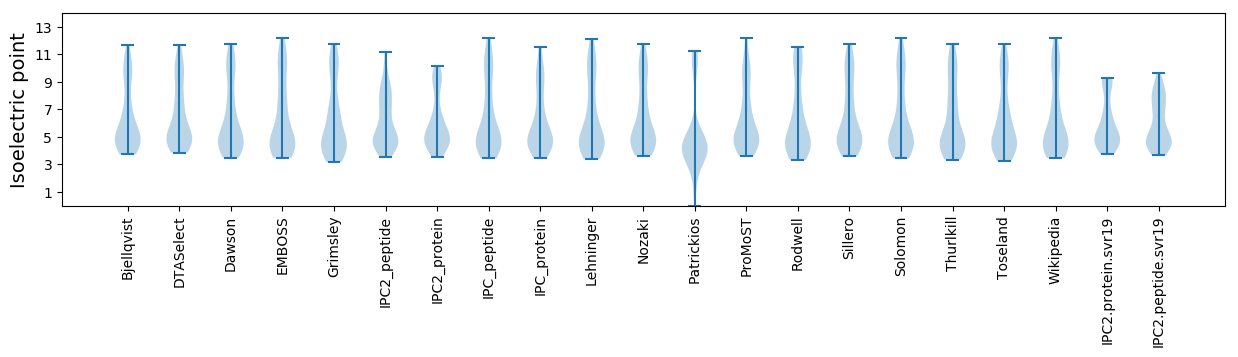
* You can choose from 21 different methods for calculating isoelectric point
Summary statistics related to proteome-wise predictions
Protein with the lowest isoelectric point:
>tr|A0A1X9SFA2|A0A1X9SFA2_9CAUD Minor tail protein OS=Mycobacterium phage Journey13 OX=1983408 GN=SEA_JOURNEY13_26 PE=4 SV=1
MM1 pKa = 7.38YY2 pKa = 10.61RR3 pKa = 11.84LTDD6 pKa = 3.06NHH8 pKa = 6.03GNVWQASDD16 pKa = 4.76IDD18 pKa = 4.3EE19 pKa = 4.57AWDD22 pKa = 3.47AAEE25 pKa = 5.41EE26 pKa = 4.11IATDD30 pKa = 3.44SGIWGGGFDD39 pKa = 4.18IEE41 pKa = 4.47GTEE44 pKa = 4.02VLAYY48 pKa = 9.72DD49 pKa = 4.29AKK51 pKa = 10.94GVAHH55 pKa = 6.15TVGTCVVGG63 pKa = 3.65
MM1 pKa = 7.38YY2 pKa = 10.61RR3 pKa = 11.84LTDD6 pKa = 3.06NHH8 pKa = 6.03GNVWQASDD16 pKa = 4.76IDD18 pKa = 4.3EE19 pKa = 4.57AWDD22 pKa = 3.47AAEE25 pKa = 5.41EE26 pKa = 4.11IATDD30 pKa = 3.44SGIWGGGFDD39 pKa = 4.18IEE41 pKa = 4.47GTEE44 pKa = 4.02VLAYY48 pKa = 9.72DD49 pKa = 4.29AKK51 pKa = 10.94GVAHH55 pKa = 6.15TVGTCVVGG63 pKa = 3.65
Molecular weight: 6.69 kDa
Isoelectric point according different methods:
Protein with the highest isoelectric point:
>tr|A0A1X9SF99|A0A1X9SF99_9CAUD DNA primase OS=Mycobacterium phage Journey13 OX=1983408 GN=SEA_JOURNEY13_53 PE=4 SV=1
MM1 pKa = 7.51SGGTALMPARR11 pKa = 11.84ASIQQTAEE19 pKa = 3.87YY20 pKa = 9.91LGVSTKK26 pKa = 7.26TVRR29 pKa = 11.84RR30 pKa = 11.84YY31 pKa = 9.81IADD34 pKa = 3.74GKK36 pKa = 10.71LKK38 pKa = 10.44AVRR41 pKa = 11.84LGPRR45 pKa = 11.84LIRR48 pKa = 11.84VEE50 pKa = 4.05RR51 pKa = 11.84DD52 pKa = 3.15SVEE55 pKa = 3.78ALMRR59 pKa = 11.84PIGKK63 pKa = 9.51
MM1 pKa = 7.51SGGTALMPARR11 pKa = 11.84ASIQQTAEE19 pKa = 3.87YY20 pKa = 9.91LGVSTKK26 pKa = 7.26TVRR29 pKa = 11.84RR30 pKa = 11.84YY31 pKa = 9.81IADD34 pKa = 3.74GKK36 pKa = 10.71LKK38 pKa = 10.44AVRR41 pKa = 11.84LGPRR45 pKa = 11.84LIRR48 pKa = 11.84VEE50 pKa = 4.05RR51 pKa = 11.84DD52 pKa = 3.15SVEE55 pKa = 3.78ALMRR59 pKa = 11.84PIGKK63 pKa = 9.51
Molecular weight: 6.89 kDa
Isoelectric point according different methods:
Peptides (in silico digests for buttom-up proteomics)
Below you can find in silico digests of the whole proteome with Trypsin, Chymotrypsin, Trypsin+LysC, LysN, ArgC proteases suitable for different mass spec machines.| Try ESI |
 |
|---|
| ChTry ESI |
|
|---|
| ArgC ESI |
|
|---|
| LysN ESI |
|
|---|
| TryLysC ESI |
|
|---|
| Try MALDI |
|
|---|
| ChTry MALDI |
|
|---|
| ArgC MALDI |
|
|---|
| LysN MALDI |
|
|---|
| TryLysC MALDI |
|
|---|
| Try LTQ |
|
|---|
| ChTry LTQ |
|
|---|
| ArgC LTQ |
|
|---|
| LysN LTQ |
|
|---|
| TryLysC LTQ |
|
|---|
| Try MSlow |
|
|---|
| ChTry MSlow |
|
|---|
| ArgC MSlow |
|
|---|
| LysN MSlow |
|
|---|
| TryLysC MSlow |
|
|---|
| Try MShigh |
|
|---|
| ChTry MShigh |
|
|---|
| ArgC MShigh |
|
|---|
| LysN MShigh |
|
|---|
| TryLysC MShigh |
|
|---|
General Statistics
Number of major isoforms |
Number of additional isoforms |
Number of all proteins |
Number of amino acids |
Min. Seq. Length |
Max. Seq. Length |
Avg. Seq. Length |
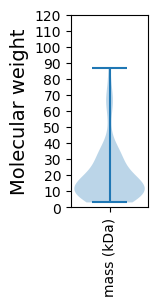
Avg. Mol. Weight |
|---|---|---|---|---|---|---|---|
0 |
15017 |
24 |
838 |
185.4 |
20.51 |
Amino acid frequency
Ala |
Cys |
Asp |
Glu |
Phe |
Gly |
His |
Ile |
Lys |
Leu |
|---|---|---|---|---|---|---|---|---|---|
9.969 ± 0.36 | 0.926 ± 0.118 |
6.439 ± 0.253 | 7.072 ± 0.323 |
3.383 ± 0.175 | 8.337 ± 0.426 |
1.838 ± 0.165 | 5.307 ± 0.182 |
4.362 ± 0.274 | 8.031 ± 0.37 |
Met |
Asn |
Gln |
Pro |
Arg |
Ser |
Thr |
Val |
Trp |
Tyr |
|---|---|---|---|---|---|---|---|---|---|
2.504 ± 0.137 | 3.336 ± 0.168 |
5.574 ± 0.222 | 3.496 ± 0.204 |
6.599 ± 0.402 | 5.128 ± 0.224 |
5.873 ± 0.281 | 6.932 ± 0.189 |
1.871 ± 0.155 | 3.023 ± 0.191 |
Most of the basic statistics you can see at this page can be downloaded from this CSV file
See this proteome in:

Proteome-pI is available under Creative Commons Attribution-NoDerivs license, for more details see here
| Reference: Kozlowski LP. Proteome-pI 2.0: Proteome Isoelectric Point Database Update. Nucleic Acids Res. 2021, doi: 10.1093/nar/gkab944 | Contact: Lukasz P. Kozlowski |