Vibrio phage VBM1
Taxonomy: Viruses; Duplodnaviria; Heunggongvirae; Uroviricota; Caudoviricetes; Caudovirales; Myoviridae; unclassified Myoviridae
Average proteome isoelectric point is 6.37
Get precalculated fractions of proteins
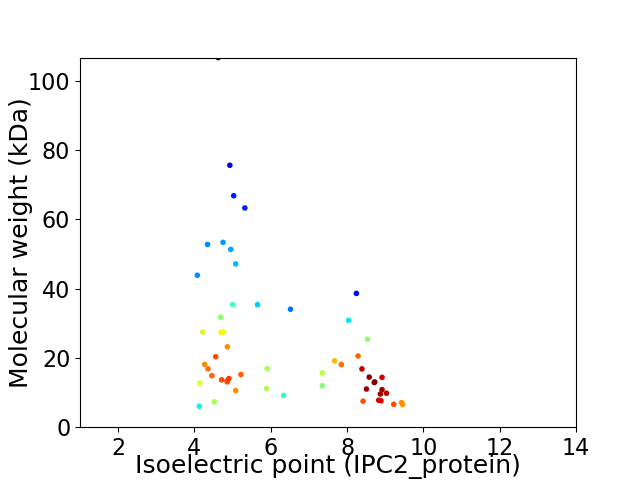
Virtual 2D-PAGE plot for 56 proteins (isoelectric point calculated using IPC2_protein)
Get csv file with sequences according to given criteria:
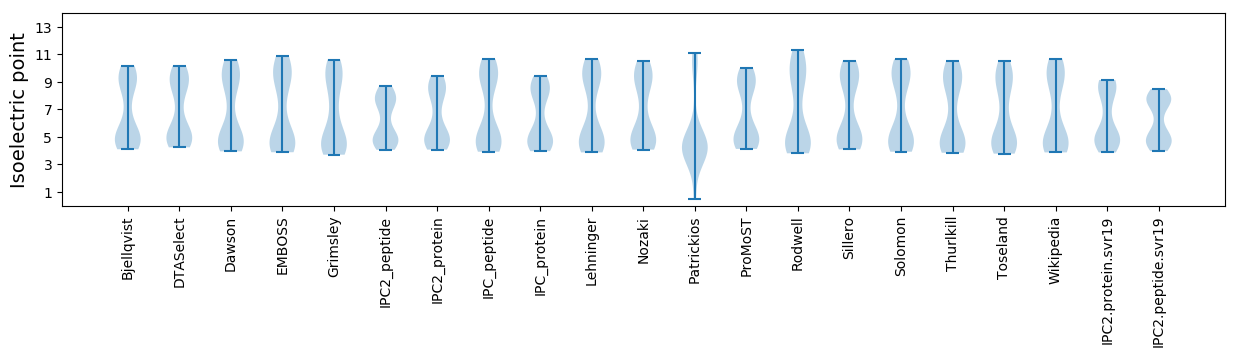
* You can choose from 21 different methods for calculating isoelectric point
Summary statistics related to proteome-wise predictions
Protein with the lowest isoelectric point:
>tr|M4PML2|M4PML2_9CAUD Uncharacterized protein OS=Vibrio phage VBM1 OX=754074 GN=VPGG_00020 PE=4 SV=1
MM1 pKa = 7.69VNDD4 pKa = 4.51CDD6 pKa = 3.51MPAPYY11 pKa = 9.75RR12 pKa = 11.84YY13 pKa = 8.11TPDD16 pKa = 3.03EE17 pKa = 4.43VEE19 pKa = 3.91WMIEE23 pKa = 3.58NSIPMLRR30 pKa = 11.84WFDD33 pKa = 4.2EE34 pKa = 4.0YY35 pKa = 11.75DD36 pKa = 3.25LAYY39 pKa = 9.36PKK41 pKa = 10.48CLEE44 pKa = 4.13SAKK47 pKa = 10.88SGGGQQ52 pKa = 2.98
MM1 pKa = 7.69VNDD4 pKa = 4.51CDD6 pKa = 3.51MPAPYY11 pKa = 9.75RR12 pKa = 11.84YY13 pKa = 8.11TPDD16 pKa = 3.03EE17 pKa = 4.43VEE19 pKa = 3.91WMIEE23 pKa = 3.58NSIPMLRR30 pKa = 11.84WFDD33 pKa = 4.2EE34 pKa = 4.0YY35 pKa = 11.75DD36 pKa = 3.25LAYY39 pKa = 9.36PKK41 pKa = 10.48CLEE44 pKa = 4.13SAKK47 pKa = 10.88SGGGQQ52 pKa = 2.98
Molecular weight: 6.06 kDa
Isoelectric point according different methods:
Protein with the highest isoelectric point:
>tr|M4PMP1|M4PMP1_9CAUD Uncharacterized protein OS=Vibrio phage VBM1 OX=754074 GN=VPGG_00050 PE=4 SV=1
MM1 pKa = 7.68KK2 pKa = 10.12APNGATHH9 pKa = 6.64KK10 pKa = 10.2CGNVFYY16 pKa = 10.96KK17 pKa = 10.3IGKK20 pKa = 8.68KK21 pKa = 10.35KK22 pKa = 10.46NFKK25 pKa = 10.18KK26 pKa = 10.89YY27 pKa = 8.96YY28 pKa = 10.14DD29 pKa = 4.5SVFFWNGQRR38 pKa = 11.84WEE40 pKa = 4.16RR41 pKa = 11.84TFCFPEE47 pKa = 3.91AQKK50 pKa = 10.07MVRR53 pKa = 11.84VV54 pKa = 3.9
MM1 pKa = 7.68KK2 pKa = 10.12APNGATHH9 pKa = 6.64KK10 pKa = 10.2CGNVFYY16 pKa = 10.96KK17 pKa = 10.3IGKK20 pKa = 8.68KK21 pKa = 10.35KK22 pKa = 10.46NFKK25 pKa = 10.18KK26 pKa = 10.89YY27 pKa = 8.96YY28 pKa = 10.14DD29 pKa = 4.5SVFFWNGQRR38 pKa = 11.84WEE40 pKa = 4.16RR41 pKa = 11.84TFCFPEE47 pKa = 3.91AQKK50 pKa = 10.07MVRR53 pKa = 11.84VV54 pKa = 3.9
Molecular weight: 6.51 kDa
Isoelectric point according different methods:
Peptides (in silico digests for buttom-up proteomics)
Below you can find in silico digests of the whole proteome with Trypsin, Chymotrypsin, Trypsin+LysC, LysN, ArgC proteases suitable for different mass spec machines.| Try ESI |
 |
|---|
| ChTry ESI |
|
|---|
| ArgC ESI |
|
|---|
| LysN ESI |
|
|---|
| TryLysC ESI |
|
|---|
| Try MALDI |
|
|---|
| ChTry MALDI |
|
|---|
| ArgC MALDI |
|
|---|
| LysN MALDI |
|
|---|
| TryLysC MALDI |
|
|---|
| Try LTQ |
|
|---|
| ChTry LTQ |
|
|---|
| ArgC LTQ |
|
|---|
| LysN LTQ |
|
|---|
| TryLysC LTQ |
|
|---|
| Try MSlow |
|
|---|
| ChTry MSlow |
|
|---|
| ArgC MSlow |
|
|---|
| LysN MSlow |
|
|---|
| TryLysC MSlow |
|
|---|
| Try MShigh |
|
|---|
| ChTry MShigh |
|
|---|
| ArgC MShigh |
|
|---|
| LysN MShigh |
|
|---|
| TryLysC MShigh |
|
|---|
General Statistics
Number of major isoforms |
Number of additional isoforms |
Number of all proteins |
Number of amino acids |
Min. Seq. Length |
Max. Seq. Length |
Avg. Seq. Length |
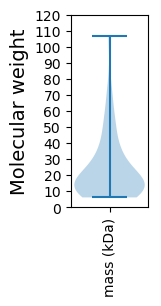
Avg. Mol. Weight |
|---|---|---|---|---|---|---|---|
0 |
12091 |
52 |
941 |
215.9 |
24.16 |
Amino acid frequency
Ala |
Cys |
Asp |
Glu |
Phe |
Gly |
His |
Ile |
Lys |
Leu |
|---|---|---|---|---|---|---|---|---|---|
6.691 ± 0.385 | 1.009 ± 0.129 |
6.443 ± 0.253 | 7.344 ± 0.505 |
4.334 ± 0.228 | 6.898 ± 0.291 |
1.464 ± 0.134 | 6.377 ± 0.186 |
7.146 ± 0.437 | 8.064 ± 0.209 |
Met |
Asn |
Gln |
Pro |
Arg |
Ser |
Thr |
Val |
Trp |
Tyr |
|---|---|---|---|---|---|---|---|---|---|
2.365 ± 0.151 | 5.194 ± 0.158 |
3.532 ± 0.177 | 3.937 ± 0.149 |
4.243 ± 0.231 | 7.948 ± 0.302 |
5.823 ± 0.361 | 6.509 ± 0.309 |
1.224 ± 0.119 | 3.457 ± 0.206 |
Most of the basic statistics you can see at this page can be downloaded from this CSV file
See this proteome in:

Proteome-pI is available under Creative Commons Attribution-NoDerivs license, for more details see here
| Reference: Kozlowski LP. Proteome-pI 2.0: Proteome Isoelectric Point Database Update. Nucleic Acids Res. 2021, doi: 10.1093/nar/gkab944 | Contact: Lukasz P. Kozlowski |