Arthrobacter sp. RIT-PI-e
Taxonomy: cellular organisms; Bacteria; Terrabacteria group; Actinobacteria; Actinomycetia; Micrococcales; Micrococcaceae; Arthrobacter; unclassified Arthrobacter
Average proteome isoelectric point is 6.06
Get precalculated fractions of proteins
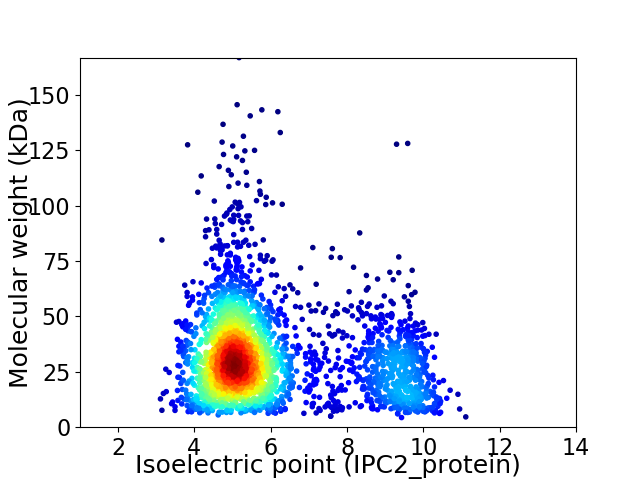
Virtual 2D-PAGE plot for 2792 proteins (isoelectric point calculated using IPC2_protein)
Get csv file with sequences according to given criteria:
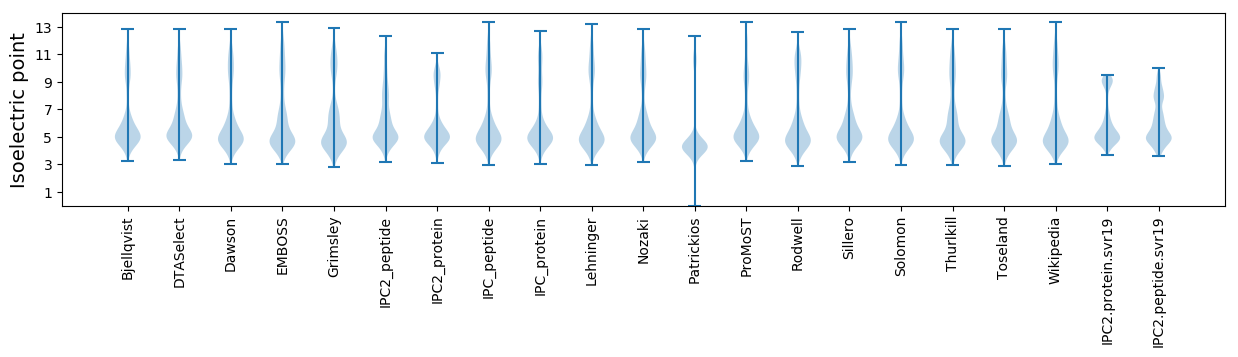
* You can choose from 21 different methods for calculating isoelectric point
Summary statistics related to proteome-wise predictions
Protein with the lowest isoelectric point:
>tr|A0A0L0BBL2|A0A0L0BBL2_9MICC SCP_3 domain-containing protein OS=Arthrobacter sp. RIT-PI-e OX=1681197 GN=AC792_14595 PE=4 SV=1
MM1 pKa = 7.33SRR3 pKa = 11.84GGPGYY8 pKa = 10.17GDD10 pKa = 3.18PVGDD14 pKa = 3.33VRR16 pKa = 11.84RR17 pKa = 11.84AGRR20 pKa = 11.84SLLLVTVLALASCASQDD37 pKa = 3.2GSGNAFPGGAVPDD50 pKa = 4.03YY51 pKa = 10.52QLGGAYY57 pKa = 8.14EE58 pKa = 4.2PPADD62 pKa = 3.44VGVVVRR68 pKa = 11.84DD69 pKa = 3.91ASDD72 pKa = 3.42EE73 pKa = 4.04PAEE76 pKa = 4.66GIYY79 pKa = 10.07SICYY83 pKa = 9.87LNAFQTQPGEE93 pKa = 4.1EE94 pKa = 4.24RR95 pKa = 11.84SWLAADD101 pKa = 4.95LVLEE105 pKa = 4.19VDD107 pKa = 4.68GEE109 pKa = 4.5PVTDD113 pKa = 4.51PDD115 pKa = 3.78WPDD118 pKa = 3.2EE119 pKa = 4.02YY120 pKa = 11.64LLDD123 pKa = 3.92TGTDD127 pKa = 3.16AKK129 pKa = 10.4RR130 pKa = 11.84AAVADD135 pKa = 5.13RR136 pKa = 11.84IGTAIDD142 pKa = 3.46GCADD146 pKa = 3.43SGFDD150 pKa = 5.22AVEE153 pKa = 4.06LDD155 pKa = 3.9NLDD158 pKa = 3.26SYY160 pKa = 11.47LRR162 pKa = 11.84SEE164 pKa = 4.81GRR166 pKa = 11.84LTLDD170 pKa = 4.12DD171 pKa = 4.24NVMLARR177 pKa = 11.84TLAEE181 pKa = 4.02RR182 pKa = 11.84AHH184 pKa = 7.04DD185 pKa = 4.42LGLQVGQKK193 pKa = 9.7NAAEE197 pKa = 4.04EE198 pKa = 4.18SAALQDD204 pKa = 3.49AGFDD208 pKa = 3.54FAVAEE213 pKa = 4.03QCVEE217 pKa = 4.1FEE219 pKa = 4.25EE220 pKa = 5.48CDD222 pKa = 3.32AYY224 pKa = 10.25TDD226 pKa = 3.82VYY228 pKa = 11.09GEE230 pKa = 4.07AVLAVEE236 pKa = 4.49YY237 pKa = 9.97PEE239 pKa = 5.14EE240 pKa = 5.09SGLPDD245 pKa = 3.59PCAVDD250 pKa = 3.8GRR252 pKa = 11.84PASTVLRR259 pKa = 11.84DD260 pKa = 3.8LEE262 pKa = 4.71LVTPADD268 pKa = 3.29PGYY271 pKa = 10.87LYY273 pKa = 10.4RR274 pKa = 11.84ACC276 pKa = 5.04
MM1 pKa = 7.33SRR3 pKa = 11.84GGPGYY8 pKa = 10.17GDD10 pKa = 3.18PVGDD14 pKa = 3.33VRR16 pKa = 11.84RR17 pKa = 11.84AGRR20 pKa = 11.84SLLLVTVLALASCASQDD37 pKa = 3.2GSGNAFPGGAVPDD50 pKa = 4.03YY51 pKa = 10.52QLGGAYY57 pKa = 8.14EE58 pKa = 4.2PPADD62 pKa = 3.44VGVVVRR68 pKa = 11.84DD69 pKa = 3.91ASDD72 pKa = 3.42EE73 pKa = 4.04PAEE76 pKa = 4.66GIYY79 pKa = 10.07SICYY83 pKa = 9.87LNAFQTQPGEE93 pKa = 4.1EE94 pKa = 4.24RR95 pKa = 11.84SWLAADD101 pKa = 4.95LVLEE105 pKa = 4.19VDD107 pKa = 4.68GEE109 pKa = 4.5PVTDD113 pKa = 4.51PDD115 pKa = 3.78WPDD118 pKa = 3.2EE119 pKa = 4.02YY120 pKa = 11.64LLDD123 pKa = 3.92TGTDD127 pKa = 3.16AKK129 pKa = 10.4RR130 pKa = 11.84AAVADD135 pKa = 5.13RR136 pKa = 11.84IGTAIDD142 pKa = 3.46GCADD146 pKa = 3.43SGFDD150 pKa = 5.22AVEE153 pKa = 4.06LDD155 pKa = 3.9NLDD158 pKa = 3.26SYY160 pKa = 11.47LRR162 pKa = 11.84SEE164 pKa = 4.81GRR166 pKa = 11.84LTLDD170 pKa = 4.12DD171 pKa = 4.24NVMLARR177 pKa = 11.84TLAEE181 pKa = 4.02RR182 pKa = 11.84AHH184 pKa = 7.04DD185 pKa = 4.42LGLQVGQKK193 pKa = 9.7NAAEE197 pKa = 4.04EE198 pKa = 4.18SAALQDD204 pKa = 3.49AGFDD208 pKa = 3.54FAVAEE213 pKa = 4.03QCVEE217 pKa = 4.1FEE219 pKa = 4.25EE220 pKa = 5.48CDD222 pKa = 3.32AYY224 pKa = 10.25TDD226 pKa = 3.82VYY228 pKa = 11.09GEE230 pKa = 4.07AVLAVEE236 pKa = 4.49YY237 pKa = 9.97PEE239 pKa = 5.14EE240 pKa = 5.09SGLPDD245 pKa = 3.59PCAVDD250 pKa = 3.8GRR252 pKa = 11.84PASTVLRR259 pKa = 11.84DD260 pKa = 3.8LEE262 pKa = 4.71LVTPADD268 pKa = 3.29PGYY271 pKa = 10.87LYY273 pKa = 10.4RR274 pKa = 11.84ACC276 pKa = 5.04
Molecular weight: 29.17 kDa
Isoelectric point according different methods:
Protein with the highest isoelectric point:
>tr|A0A0L0BM10|A0A0L0BM10_9MICC XRE family transcriptional regulator OS=Arthrobacter sp. RIT-PI-e OX=1681197 GN=AC792_02000 PE=4 SV=1
MM1 pKa = 7.61KK2 pKa = 10.31VRR4 pKa = 11.84NSLRR8 pKa = 11.84ALKK11 pKa = 9.69KK12 pKa = 9.55IPGSQVVRR20 pKa = 11.84RR21 pKa = 11.84RR22 pKa = 11.84GRR24 pKa = 11.84TFVINKK30 pKa = 8.58KK31 pKa = 9.2NPRR34 pKa = 11.84IKK36 pKa = 10.52ARR38 pKa = 11.84QGG40 pKa = 2.94
MM1 pKa = 7.61KK2 pKa = 10.31VRR4 pKa = 11.84NSLRR8 pKa = 11.84ALKK11 pKa = 9.69KK12 pKa = 9.55IPGSQVVRR20 pKa = 11.84RR21 pKa = 11.84RR22 pKa = 11.84GRR24 pKa = 11.84TFVINKK30 pKa = 8.58KK31 pKa = 9.2NPRR34 pKa = 11.84IKK36 pKa = 10.52ARR38 pKa = 11.84QGG40 pKa = 2.94
Molecular weight: 4.66 kDa
Isoelectric point according different methods:
Peptides (in silico digests for buttom-up proteomics)
Below you can find in silico digests of the whole proteome with Trypsin, Chymotrypsin, Trypsin+LysC, LysN, ArgC proteases suitable for different mass spec machines.| Try ESI |
 |
|---|
| ChTry ESI |
|
|---|
| ArgC ESI |
|
|---|
| LysN ESI |
|
|---|
| TryLysC ESI |
|
|---|
| Try MALDI |
|
|---|
| ChTry MALDI |
|
|---|
| ArgC MALDI |
|
|---|
| LysN MALDI |
|
|---|
| TryLysC MALDI |
|
|---|
| Try LTQ |
|
|---|
| ChTry LTQ |
|
|---|
| ArgC LTQ |
|
|---|
| LysN LTQ |
|
|---|
| TryLysC LTQ |
|
|---|
| Try MSlow |
|
|---|
| ChTry MSlow |
|
|---|
| ArgC MSlow |
|
|---|
| LysN MSlow |
|
|---|
| TryLysC MSlow |
|
|---|
| Try MShigh |
|
|---|
| ChTry MShigh |
|
|---|
| ArgC MShigh |
|
|---|
| LysN MShigh |
|
|---|
| TryLysC MShigh |
|
|---|
General Statistics
Number of major isoforms |
Number of additional isoforms |
Number of all proteins |
Number of amino acids |
Min. Seq. Length |
Max. Seq. Length |
Avg. Seq. Length |
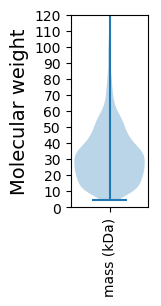
Avg. Mol. Weight |
|---|---|---|---|---|---|---|---|
0 |
870992 |
37 |
1536 |
312.0 |
33.35 |
Amino acid frequency
Ala |
Cys |
Asp |
Glu |
Phe |
Gly |
His |
Ile |
Lys |
Leu |
|---|---|---|---|---|---|---|---|---|---|
12.668 ± 0.074 | 0.562 ± 0.01 |
5.992 ± 0.039 | 5.821 ± 0.049 |
3.086 ± 0.029 | 9.401 ± 0.041 |
2.092 ± 0.022 | 4.118 ± 0.034 |
1.915 ± 0.036 | 10.492 ± 0.056 |
Met |
Asn |
Gln |
Pro |
Arg |
Ser |
Thr |
Val |
Trp |
Tyr |
|---|---|---|---|---|---|---|---|---|---|
1.849 ± 0.018 | 2.032 ± 0.027 |
5.576 ± 0.039 | 2.912 ± 0.024 |
7.19 ± 0.046 | 5.774 ± 0.033 |
6.251 ± 0.038 | 8.906 ± 0.037 |
1.351 ± 0.02 | 2.01 ± 0.025 |
Most of the basic statistics you can see at this page can be downloaded from this CSV file
See this proteome in:

Proteome-pI is available under Creative Commons Attribution-NoDerivs license, for more details see here
| Reference: Kozlowski LP. Proteome-pI 2.0: Proteome Isoelectric Point Database Update. Nucleic Acids Res. 2021, doi: 10.1093/nar/gkab944 | Contact: Lukasz P. Kozlowski |