Micromonospora haikouensis
Taxonomy: cellular organisms; Bacteria; Terrabacteria group; Actinobacteria; Actinomycetia; Micromonosporales; Micromonosporaceae; Micromonospora
Average proteome isoelectric point is 6.59
Get precalculated fractions of proteins
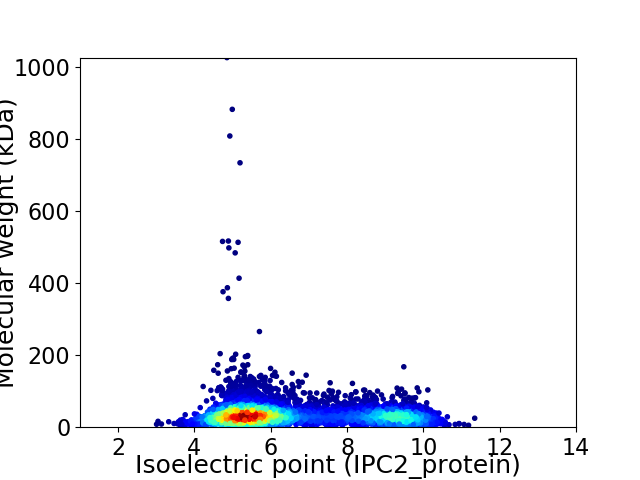
Virtual 2D-PAGE plot for 5591 proteins (isoelectric point calculated using IPC2_protein)
Get csv file with sequences according to given criteria:
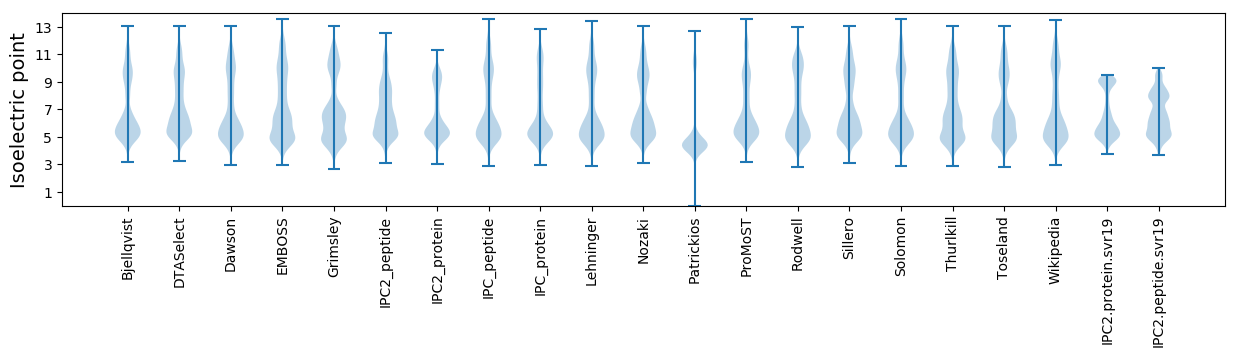
* You can choose from 21 different methods for calculating isoelectric point
Summary statistics related to proteome-wise predictions
Protein with the lowest isoelectric point:
>tr|A0A0D0WS75|A0A0D0WS75_9ACTN Probable RNA 2'-phosphotransferase OS=Micromonospora haikouensis OX=686309 GN=kptA PE=3 SV=1
MM1 pKa = 7.66SEE3 pKa = 4.02VATDD7 pKa = 3.8QLQVWVDD14 pKa = 3.37QDD16 pKa = 3.81LCTGDD21 pKa = 3.99GLCVQYY27 pKa = 10.98APEE30 pKa = 4.07VFEE33 pKa = 4.79FDD35 pKa = 3.39VDD37 pKa = 3.3GLAYY41 pKa = 10.67VKK43 pKa = 10.76GADD46 pKa = 4.81GEE48 pKa = 4.43LQLAPGSRR56 pKa = 11.84VGVPEE61 pKa = 3.85HH62 pKa = 6.58LRR64 pKa = 11.84LEE66 pKa = 4.75VIDD69 pKa = 4.27SAKK72 pKa = 10.05EE73 pKa = 3.91CPGEE77 pKa = 4.37CIHH80 pKa = 6.22VVRR83 pKa = 11.84GDD85 pKa = 3.65GVEE88 pKa = 4.14VAGPDD93 pKa = 4.19AEE95 pKa = 5.6DD96 pKa = 3.86DD97 pKa = 3.66
MM1 pKa = 7.66SEE3 pKa = 4.02VATDD7 pKa = 3.8QLQVWVDD14 pKa = 3.37QDD16 pKa = 3.81LCTGDD21 pKa = 3.99GLCVQYY27 pKa = 10.98APEE30 pKa = 4.07VFEE33 pKa = 4.79FDD35 pKa = 3.39VDD37 pKa = 3.3GLAYY41 pKa = 10.67VKK43 pKa = 10.76GADD46 pKa = 4.81GEE48 pKa = 4.43LQLAPGSRR56 pKa = 11.84VGVPEE61 pKa = 3.85HH62 pKa = 6.58LRR64 pKa = 11.84LEE66 pKa = 4.75VIDD69 pKa = 4.27SAKK72 pKa = 10.05EE73 pKa = 3.91CPGEE77 pKa = 4.37CIHH80 pKa = 6.22VVRR83 pKa = 11.84GDD85 pKa = 3.65GVEE88 pKa = 4.14VAGPDD93 pKa = 4.19AEE95 pKa = 5.6DD96 pKa = 3.86DD97 pKa = 3.66
Molecular weight: 10.35 kDa
Isoelectric point according different methods:
Protein with the highest isoelectric point:
>tr|A0A0D0VJY3|A0A0D0VJY3_9ACTN 3-oxoacyl-ACP reductase OS=Micromonospora haikouensis OX=686309 GN=GA0070558_11089 PE=4 SV=1
MM1 pKa = 7.92AEE3 pKa = 3.99AQKK6 pKa = 10.24ATTRR10 pKa = 11.84PAAQRR15 pKa = 11.84TTAKK19 pKa = 8.77KK20 pKa = 7.48TAAAGRR26 pKa = 11.84ATGTTRR32 pKa = 11.84AATTATRR39 pKa = 11.84RR40 pKa = 11.84STVTKK45 pKa = 10.39ASPNASGAGAGRR57 pKa = 11.84VPAKK61 pKa = 10.35KK62 pKa = 10.12AVAKK66 pKa = 10.15KK67 pKa = 10.06AAATKK72 pKa = 10.0VATSRR77 pKa = 11.84TPVGSRR83 pKa = 11.84TAAKK87 pKa = 9.77KK88 pKa = 10.62APATRR93 pKa = 11.84ASAKK97 pKa = 9.68KK98 pKa = 10.29APAAKK103 pKa = 7.12TTTARR108 pKa = 11.84KK109 pKa = 4.74TTAAKK114 pKa = 6.51TTAAKK119 pKa = 7.22TTATKK124 pKa = 9.09TARR127 pKa = 11.84SATGAAATKK136 pKa = 9.17RR137 pKa = 11.84TTAATKK143 pKa = 10.1KK144 pKa = 10.22ASPAAKK150 pKa = 8.87RR151 pKa = 11.84TTTTAAKK158 pKa = 8.29RR159 pKa = 11.84TTAAKK164 pKa = 10.24RR165 pKa = 11.84AGATAAKK172 pKa = 8.2RR173 pKa = 11.84TTAAAAKK180 pKa = 9.15KK181 pKa = 10.4APTAAKK187 pKa = 8.6RR188 pKa = 11.84TAAAAKK194 pKa = 9.14KK195 pKa = 10.33APAAKK200 pKa = 8.72KK201 pKa = 6.09TTARR205 pKa = 11.84KK206 pKa = 5.48TTVAKK211 pKa = 10.21KK212 pKa = 10.54APAAKK217 pKa = 8.72KK218 pKa = 6.09TTARR222 pKa = 11.84KK223 pKa = 5.2TTSSRR228 pKa = 11.84STATRR233 pKa = 11.84TATAKK238 pKa = 10.18KK239 pKa = 9.95APARR243 pKa = 11.84KK244 pKa = 8.34STSSRR249 pKa = 11.84NPP251 pKa = 3.06
MM1 pKa = 7.92AEE3 pKa = 3.99AQKK6 pKa = 10.24ATTRR10 pKa = 11.84PAAQRR15 pKa = 11.84TTAKK19 pKa = 8.77KK20 pKa = 7.48TAAAGRR26 pKa = 11.84ATGTTRR32 pKa = 11.84AATTATRR39 pKa = 11.84RR40 pKa = 11.84STVTKK45 pKa = 10.39ASPNASGAGAGRR57 pKa = 11.84VPAKK61 pKa = 10.35KK62 pKa = 10.12AVAKK66 pKa = 10.15KK67 pKa = 10.06AAATKK72 pKa = 10.0VATSRR77 pKa = 11.84TPVGSRR83 pKa = 11.84TAAKK87 pKa = 9.77KK88 pKa = 10.62APATRR93 pKa = 11.84ASAKK97 pKa = 9.68KK98 pKa = 10.29APAAKK103 pKa = 7.12TTTARR108 pKa = 11.84KK109 pKa = 4.74TTAAKK114 pKa = 6.51TTAAKK119 pKa = 7.22TTATKK124 pKa = 9.09TARR127 pKa = 11.84SATGAAATKK136 pKa = 9.17RR137 pKa = 11.84TTAATKK143 pKa = 10.1KK144 pKa = 10.22ASPAAKK150 pKa = 8.87RR151 pKa = 11.84TTTTAAKK158 pKa = 8.29RR159 pKa = 11.84TTAAKK164 pKa = 10.24RR165 pKa = 11.84AGATAAKK172 pKa = 8.2RR173 pKa = 11.84TTAAAAKK180 pKa = 9.15KK181 pKa = 10.4APTAAKK187 pKa = 8.6RR188 pKa = 11.84TAAAAKK194 pKa = 9.14KK195 pKa = 10.33APAAKK200 pKa = 8.72KK201 pKa = 6.09TTARR205 pKa = 11.84KK206 pKa = 5.48TTVAKK211 pKa = 10.21KK212 pKa = 10.54APAAKK217 pKa = 8.72KK218 pKa = 6.09TTARR222 pKa = 11.84KK223 pKa = 5.2TTSSRR228 pKa = 11.84STATRR233 pKa = 11.84TATAKK238 pKa = 10.18KK239 pKa = 9.95APARR243 pKa = 11.84KK244 pKa = 8.34STSSRR249 pKa = 11.84NPP251 pKa = 3.06
Molecular weight: 24.89 kDa
Isoelectric point according different methods:
Peptides (in silico digests for buttom-up proteomics)
Below you can find in silico digests of the whole proteome with Trypsin, Chymotrypsin, Trypsin+LysC, LysN, ArgC proteases suitable for different mass spec machines.| Try ESI |
 |
|---|
| ChTry ESI |
|
|---|
| ArgC ESI |
|
|---|
| LysN ESI |
|
|---|
| TryLysC ESI |
|
|---|
| Try MALDI |
|
|---|
| ChTry MALDI |
|
|---|
| ArgC MALDI |
|
|---|
| LysN MALDI |
|
|---|
| TryLysC MALDI |
|
|---|
| Try LTQ |
|
|---|
| ChTry LTQ |
|
|---|
| ArgC LTQ |
|
|---|
| LysN LTQ |
|
|---|
| TryLysC LTQ |
|
|---|
| Try MSlow |
|
|---|
| ChTry MSlow |
|
|---|
| ArgC MSlow |
|
|---|
| LysN MSlow |
|
|---|
| TryLysC MSlow |
|
|---|
| Try MShigh |
|
|---|
| ChTry MShigh |
|
|---|
| ArgC MShigh |
|
|---|
| LysN MShigh |
|
|---|
| TryLysC MShigh |
|
|---|
General Statistics
Number of major isoforms |
Number of additional isoforms |
Number of all proteins |
Number of amino acids |
Min. Seq. Length |
Max. Seq. Length |
Avg. Seq. Length |
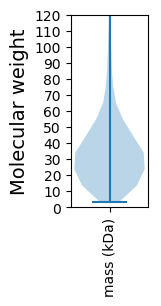
Avg. Mol. Weight |
|---|---|---|---|---|---|---|---|
0 |
1931850 |
29 |
10006 |
345.5 |
36.78 |
Amino acid frequency
Ala |
Cys |
Asp |
Glu |
Phe |
Gly |
His |
Ile |
Lys |
Leu |
|---|---|---|---|---|---|---|---|---|---|
14.564 ± 0.057 | 0.747 ± 0.008 |
6.157 ± 0.031 | 4.915 ± 0.03 |
2.661 ± 0.019 | 9.64 ± 0.032 |
2.145 ± 0.015 | 2.886 ± 0.023 |
1.571 ± 0.024 | 10.453 ± 0.044 |
Met |
Asn |
Gln |
Pro |
Arg |
Ser |
Thr |
Val |
Trp |
Tyr |
|---|---|---|---|---|---|---|---|---|---|
1.527 ± 0.013 | 1.779 ± 0.022 |
6.459 ± 0.032 | 2.663 ± 0.019 |
8.438 ± 0.036 | 4.504 ± 0.025 |
6.07 ± 0.034 | 9.168 ± 0.028 |
1.599 ± 0.014 | 2.054 ± 0.017 |
Most of the basic statistics you can see at this page can be downloaded from this CSV file
See this proteome in:

Proteome-pI is available under Creative Commons Attribution-NoDerivs license, for more details see here
| Reference: Kozlowski LP. Proteome-pI 2.0: Proteome Isoelectric Point Database Update. Nucleic Acids Res. 2021, doi: 10.1093/nar/gkab944 | Contact: Lukasz P. Kozlowski |