Caldibacillus phage CBP1
Taxonomy: Viruses; Duplodnaviria; Heunggongvirae; Uroviricota; Caudoviricetes; Caudovirales; Siphoviridae; unclassified Siphoviridae
Average proteome isoelectric point is 6.68
Get precalculated fractions of proteins
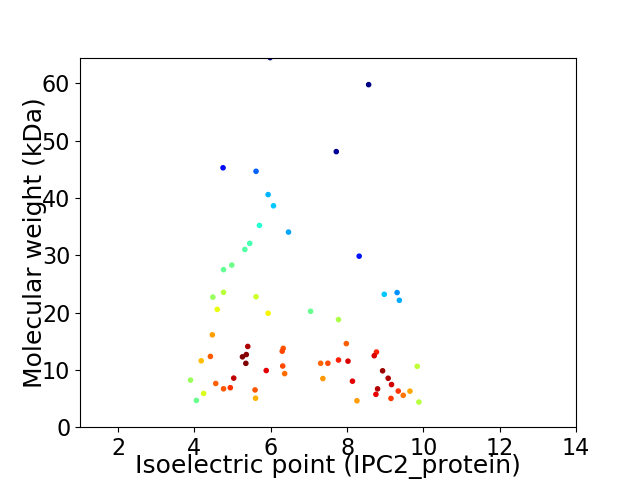
Virtual 2D-PAGE plot for 66 proteins (isoelectric point calculated using IPC2_protein)
Get csv file with sequences according to given criteria:
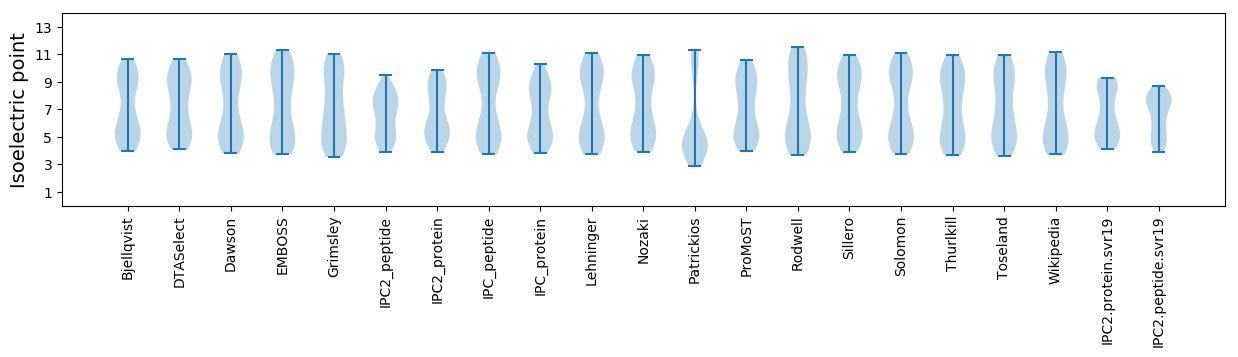
* You can choose from 21 different methods for calculating isoelectric point
Summary statistics related to proteome-wise predictions
Protein with the lowest isoelectric point:
>tr|A0A290GDV5|A0A290GDV5_9CAUD Uncharacterized protein OS=Caldibacillus phage CBP1 OX=2036768 PE=4 SV=1
MM1 pKa = 7.66AIDD4 pKa = 4.36LEE6 pKa = 4.81HH7 pKa = 6.83PVVTAIRR14 pKa = 11.84RR15 pKa = 11.84YY16 pKa = 9.93GYY18 pKa = 9.01PDD20 pKa = 4.3PEE22 pKa = 4.5PEE24 pKa = 4.06PFGDD28 pKa = 3.86DD29 pKa = 3.43FFGNEE34 pKa = 4.4VYY36 pKa = 10.46PGDD39 pKa = 4.32TILVLDD45 pKa = 5.13DD46 pKa = 4.25EE47 pKa = 5.49FFLKK51 pKa = 10.86DD52 pKa = 4.12EE53 pKa = 4.65LSEE56 pKa = 4.04DD57 pKa = 3.79AIAILEE63 pKa = 4.19HH64 pKa = 6.53FGAVEE69 pKa = 4.06ITAKK73 pKa = 10.59
MM1 pKa = 7.66AIDD4 pKa = 4.36LEE6 pKa = 4.81HH7 pKa = 6.83PVVTAIRR14 pKa = 11.84RR15 pKa = 11.84YY16 pKa = 9.93GYY18 pKa = 9.01PDD20 pKa = 4.3PEE22 pKa = 4.5PEE24 pKa = 4.06PFGDD28 pKa = 3.86DD29 pKa = 3.43FFGNEE34 pKa = 4.4VYY36 pKa = 10.46PGDD39 pKa = 4.32TILVLDD45 pKa = 5.13DD46 pKa = 4.25EE47 pKa = 5.49FFLKK51 pKa = 10.86DD52 pKa = 4.12EE53 pKa = 4.65LSEE56 pKa = 4.04DD57 pKa = 3.79AIAILEE63 pKa = 4.19HH64 pKa = 6.53FGAVEE69 pKa = 4.06ITAKK73 pKa = 10.59
Molecular weight: 8.22 kDa
Isoelectric point according different methods:
Protein with the highest isoelectric point:
>tr|A0A290FZK7|A0A290FZK7_9CAUD Roantirepressor OS=Caldibacillus phage CBP1 OX=2036768 PE=4 SV=1
MM1 pKa = 7.87VIISYY6 pKa = 9.19VNKK9 pKa = 8.55GTEE12 pKa = 3.85VTAIRR17 pKa = 11.84QGIRR21 pKa = 11.84KK22 pKa = 8.96IGKK25 pKa = 7.85ICAKK29 pKa = 9.95IMSWPGGWRR38 pKa = 11.84KK39 pKa = 9.64
MM1 pKa = 7.87VIISYY6 pKa = 9.19VNKK9 pKa = 8.55GTEE12 pKa = 3.85VTAIRR17 pKa = 11.84QGIRR21 pKa = 11.84KK22 pKa = 8.96IGKK25 pKa = 7.85ICAKK29 pKa = 9.95IMSWPGGWRR38 pKa = 11.84KK39 pKa = 9.64
Molecular weight: 4.39 kDa
Isoelectric point according different methods:
Peptides (in silico digests for buttom-up proteomics)
Below you can find in silico digests of the whole proteome with Trypsin, Chymotrypsin, Trypsin+LysC, LysN, ArgC proteases suitable for different mass spec machines.| Try ESI |
 |
|---|
| ChTry ESI |
|
|---|
| ArgC ESI |
|
|---|
| LysN ESI |
|
|---|
| TryLysC ESI |
|
|---|
| Try MALDI |
|
|---|
| ChTry MALDI |
|
|---|
| ArgC MALDI |
|
|---|
| LysN MALDI |
|
|---|
| TryLysC MALDI |
|
|---|
| Try LTQ |
|
|---|
| ChTry LTQ |
|
|---|
| ArgC LTQ |
|
|---|
| LysN LTQ |
|
|---|
| TryLysC LTQ |
|
|---|
| Try MSlow |
|
|---|
| ChTry MSlow |
|
|---|
| ArgC MSlow |
|
|---|
| LysN MSlow |
|
|---|
| TryLysC MSlow |
|
|---|
| Try MShigh |
|
|---|
| ChTry MShigh |
|
|---|
| ArgC MShigh |
|
|---|
| LysN MShigh |
|
|---|
| TryLysC MShigh |
|
|---|
General Statistics
Number of major isoforms |
Number of additional isoforms |
Number of all proteins |
Number of amino acids |
Min. Seq. Length |
Max. Seq. Length |
Avg. Seq. Length |
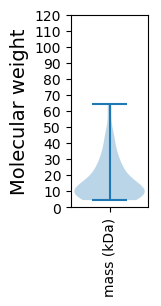
Avg. Mol. Weight |
|---|---|---|---|---|---|---|---|
0 |
10175 |
38 |
560 |
154.2 |
17.69 |
Amino acid frequency
Ala |
Cys |
Asp |
Glu |
Phe |
Gly |
His |
Ile |
Lys |
Leu |
|---|---|---|---|---|---|---|---|---|---|
6.133 ± 0.476 | 0.953 ± 0.135 |
5.808 ± 0.237 | 9.199 ± 0.271 |
4.098 ± 0.234 | 6.3 ± 0.322 |
1.602 ± 0.161 | 7.892 ± 0.277 |
9.16 ± 0.399 | 8.206 ± 0.242 |
Met |
Asn |
Gln |
Pro |
Arg |
Ser |
Thr |
Val |
Trp |
Tyr |
|---|---|---|---|---|---|---|---|---|---|
2.575 ± 0.168 | 5.17 ± 0.245 |
3.656 ± 0.206 | 3.686 ± 0.247 |
5.435 ± 0.307 | 4.727 ± 0.25 |
4.668 ± 0.263 | 5.789 ± 0.239 |
1.258 ± 0.101 | 3.686 ± 0.231 |
Most of the basic statistics you can see at this page can be downloaded from this CSV file
See this proteome in:

Proteome-pI is available under Creative Commons Attribution-NoDerivs license, for more details see here
| Reference: Kozlowski LP. Proteome-pI 2.0: Proteome Isoelectric Point Database Update. Nucleic Acids Res. 2021, doi: 10.1093/nar/gkab944 | Contact: Lukasz P. Kozlowski |