Echeneis naucrates (Live sharksucker)
Taxonomy: cellular organisms; Eukaryota; Opisthokonta; Metazoa; Eumetazoa; Bilateria; Deuterostomia; Chordata; Craniata; Vertebrata; Gnathostomata; Teleostomi; Euteleostomi; Actinopterygii; Actinopteri; Neopterygii; Teleostei; Osteoglossocephalai; Clupeocephala; Euteleosteomorpha; Neoteleostei; Eurypterygia; Ctenosquamata; Acanthomorphata;
Average proteome isoelectric point is 6.47
Get precalculated fractions of proteins
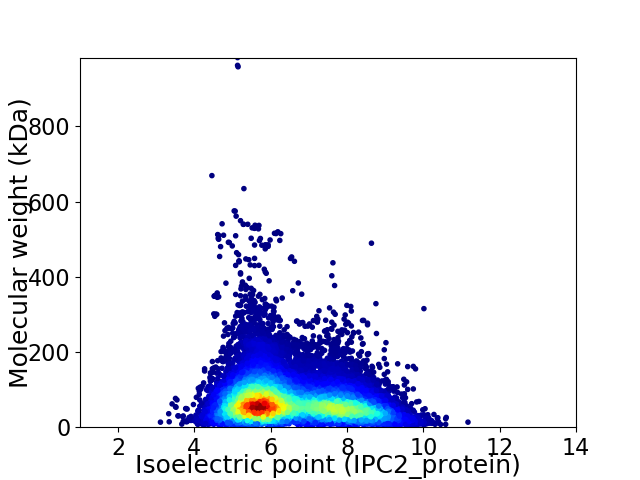
Virtual 2D-PAGE plot for 54685 proteins (isoelectric point calculated using IPC2_protein)
Get csv file with sequences according to given criteria:
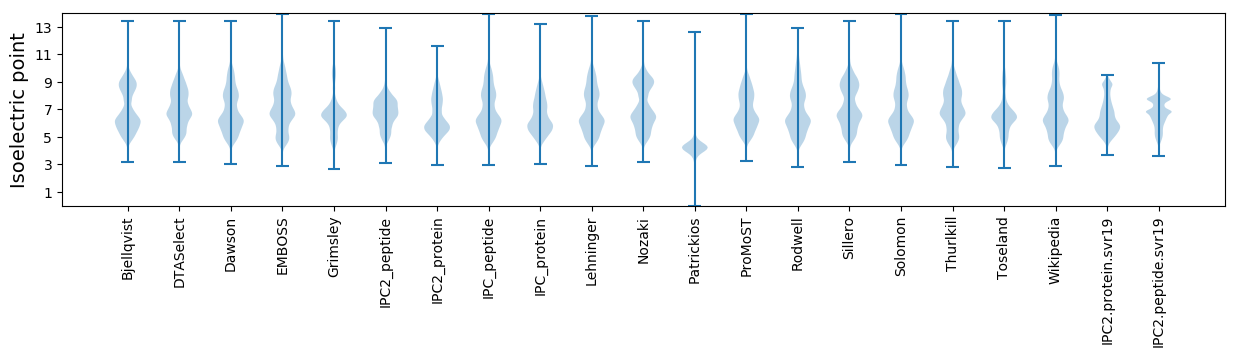
* You can choose from 21 different methods for calculating isoelectric point
Summary statistics related to proteome-wise predictions
Protein with the lowest isoelectric point:
>tr|A0A665TI60|A0A665TI60_ECHNA Isoform of A0A665TI39 Hsp90 co-chaperone Cdc37 OS=Echeneis naucrates OX=173247 PE=3 SV=1
VV1 pKa = 6.86YY2 pKa = 9.75DD3 pKa = 3.81YY4 pKa = 11.4QRR6 pKa = 11.84LCLQLGVAEE15 pKa = 4.76LVVDD19 pKa = 3.95NCRR22 pKa = 11.84SSDD25 pKa = 3.84GEE27 pKa = 4.42VEE29 pKa = 4.16GLTDD33 pKa = 4.08EE34 pKa = 4.39YY35 pKa = 11.02TGLEE39 pKa = 4.32MLSMVNVGLSSLSKK53 pKa = 10.87LPLTLEE59 pKa = 4.11VSDD62 pKa = 3.77NTISGGLDD70 pKa = 3.07SLAEE74 pKa = 3.99KK75 pKa = 10.63CPNLTYY81 pKa = 11.17LNLSGNKK88 pKa = 9.14IKK90 pKa = 10.29EE91 pKa = 3.9LSSIKK96 pKa = 10.36VLQNLKK102 pKa = 10.02NLKK105 pKa = 10.38SLDD108 pKa = 3.95LYY110 pKa = 10.58SCEE113 pKa = 4.17VTSLEE118 pKa = 4.67DD119 pKa = 3.25YY120 pKa = 10.55RR121 pKa = 11.84EE122 pKa = 4.33SVFEE126 pKa = 4.89LLPQLTYY133 pKa = 11.03LDD135 pKa = 5.36GYY137 pKa = 9.91DD138 pKa = 3.64QEE140 pKa = 5.69DD141 pKa = 3.9NEE143 pKa = 4.98AVDD146 pKa = 3.9RR147 pKa = 11.84LNDD150 pKa = 4.75FILKK154 pKa = 9.98GVADD158 pKa = 4.37PNFVPDD164 pKa = 4.29EE165 pKa = 4.64DD166 pKa = 5.64DD167 pKa = 3.5EE168 pKa = 5.29AGPPGDD174 pKa = 5.73DD175 pKa = 4.93DD176 pKa = 6.64DD177 pKa = 7.04DD178 pKa = 6.23DD179 pKa = 4.69EE180 pKa = 5.12EE181 pKa = 4.99EE182 pKa = 4.42EE183 pKa = 5.01EE184 pKa = 4.63EE185 pKa = 5.37DD186 pKa = 4.27DD187 pKa = 5.59DD188 pKa = 5.19EE189 pKa = 4.96EE190 pKa = 5.99GSEE193 pKa = 4.11GDD195 pKa = 3.43EE196 pKa = 4.51DD197 pKa = 4.5EE198 pKa = 5.23VGLSYY203 pKa = 11.24LMKK206 pKa = 10.64EE207 pKa = 5.02GIQVSLPVSWSLISGLQHH225 pKa = 7.34APQCPGRR232 pKa = 11.84RR233 pKa = 11.84TLTAYY238 pKa = 10.28YY239 pKa = 9.37VLHH242 pKa = 6.83SGPSCCSRR250 pKa = 11.84SFIVFPGG257 pKa = 3.19
VV1 pKa = 6.86YY2 pKa = 9.75DD3 pKa = 3.81YY4 pKa = 11.4QRR6 pKa = 11.84LCLQLGVAEE15 pKa = 4.76LVVDD19 pKa = 3.95NCRR22 pKa = 11.84SSDD25 pKa = 3.84GEE27 pKa = 4.42VEE29 pKa = 4.16GLTDD33 pKa = 4.08EE34 pKa = 4.39YY35 pKa = 11.02TGLEE39 pKa = 4.32MLSMVNVGLSSLSKK53 pKa = 10.87LPLTLEE59 pKa = 4.11VSDD62 pKa = 3.77NTISGGLDD70 pKa = 3.07SLAEE74 pKa = 3.99KK75 pKa = 10.63CPNLTYY81 pKa = 11.17LNLSGNKK88 pKa = 9.14IKK90 pKa = 10.29EE91 pKa = 3.9LSSIKK96 pKa = 10.36VLQNLKK102 pKa = 10.02NLKK105 pKa = 10.38SLDD108 pKa = 3.95LYY110 pKa = 10.58SCEE113 pKa = 4.17VTSLEE118 pKa = 4.67DD119 pKa = 3.25YY120 pKa = 10.55RR121 pKa = 11.84EE122 pKa = 4.33SVFEE126 pKa = 4.89LLPQLTYY133 pKa = 11.03LDD135 pKa = 5.36GYY137 pKa = 9.91DD138 pKa = 3.64QEE140 pKa = 5.69DD141 pKa = 3.9NEE143 pKa = 4.98AVDD146 pKa = 3.9RR147 pKa = 11.84LNDD150 pKa = 4.75FILKK154 pKa = 9.98GVADD158 pKa = 4.37PNFVPDD164 pKa = 4.29EE165 pKa = 4.64DD166 pKa = 5.64DD167 pKa = 3.5EE168 pKa = 5.29AGPPGDD174 pKa = 5.73DD175 pKa = 4.93DD176 pKa = 6.64DD177 pKa = 7.04DD178 pKa = 6.23DD179 pKa = 4.69EE180 pKa = 5.12EE181 pKa = 4.99EE182 pKa = 4.42EE183 pKa = 5.01EE184 pKa = 4.63EE185 pKa = 5.37DD186 pKa = 4.27DD187 pKa = 5.59DD188 pKa = 5.19EE189 pKa = 4.96EE190 pKa = 5.99GSEE193 pKa = 4.11GDD195 pKa = 3.43EE196 pKa = 4.51DD197 pKa = 4.5EE198 pKa = 5.23VGLSYY203 pKa = 11.24LMKK206 pKa = 10.64EE207 pKa = 5.02GIQVSLPVSWSLISGLQHH225 pKa = 7.34APQCPGRR232 pKa = 11.84RR233 pKa = 11.84TLTAYY238 pKa = 10.28YY239 pKa = 9.37VLHH242 pKa = 6.83SGPSCCSRR250 pKa = 11.84SFIVFPGG257 pKa = 3.19
Molecular weight: 28.33 kDa
Isoelectric point according different methods:
Protein with the highest isoelectric point:
>tr|A0A665UYY0|A0A665UYY0_ECHNA Arylformamidase OS=Echeneis naucrates OX=173247 GN=afmid PE=4 SV=1
PP1 pKa = 7.38RR2 pKa = 11.84RR3 pKa = 11.84SACWRR8 pKa = 11.84RR9 pKa = 11.84PKK11 pKa = 10.15RR12 pKa = 11.84SKK14 pKa = 10.72KK15 pKa = 7.87SWRR18 pKa = 11.84TIVGPQTRR26 pKa = 11.84EE27 pKa = 3.7GKK29 pKa = 10.6GRR31 pKa = 11.84GAQTRR36 pKa = 11.84GGKK39 pKa = 9.79GRR41 pKa = 11.84GAQTRR46 pKa = 11.84GGKK49 pKa = 9.79GRR51 pKa = 11.84GAQTRR56 pKa = 11.84GGKK59 pKa = 9.79GRR61 pKa = 11.84GAQTRR66 pKa = 11.84GGKK69 pKa = 9.79GRR71 pKa = 11.84GAQTRR76 pKa = 11.84GGKK79 pKa = 9.79GRR81 pKa = 11.84GAQTRR86 pKa = 11.84GGKK89 pKa = 9.75GRR91 pKa = 11.84GPQTRR96 pKa = 11.84GGKK99 pKa = 9.76GRR101 pKa = 11.84GPQTRR106 pKa = 11.84GGKK109 pKa = 9.75GRR111 pKa = 11.84GPQRR115 pKa = 11.84RR116 pKa = 11.84GGKK119 pKa = 9.8GRR121 pKa = 11.84GAQTRR126 pKa = 11.84GTKK129 pKa = 9.71GG130 pKa = 2.91
PP1 pKa = 7.38RR2 pKa = 11.84RR3 pKa = 11.84SACWRR8 pKa = 11.84RR9 pKa = 11.84PKK11 pKa = 10.15RR12 pKa = 11.84SKK14 pKa = 10.72KK15 pKa = 7.87SWRR18 pKa = 11.84TIVGPQTRR26 pKa = 11.84EE27 pKa = 3.7GKK29 pKa = 10.6GRR31 pKa = 11.84GAQTRR36 pKa = 11.84GGKK39 pKa = 9.79GRR41 pKa = 11.84GAQTRR46 pKa = 11.84GGKK49 pKa = 9.79GRR51 pKa = 11.84GAQTRR56 pKa = 11.84GGKK59 pKa = 9.79GRR61 pKa = 11.84GAQTRR66 pKa = 11.84GGKK69 pKa = 9.79GRR71 pKa = 11.84GAQTRR76 pKa = 11.84GGKK79 pKa = 9.79GRR81 pKa = 11.84GAQTRR86 pKa = 11.84GGKK89 pKa = 9.75GRR91 pKa = 11.84GPQTRR96 pKa = 11.84GGKK99 pKa = 9.76GRR101 pKa = 11.84GPQTRR106 pKa = 11.84GGKK109 pKa = 9.75GRR111 pKa = 11.84GPQRR115 pKa = 11.84RR116 pKa = 11.84GGKK119 pKa = 9.8GRR121 pKa = 11.84GAQTRR126 pKa = 11.84GTKK129 pKa = 9.71GG130 pKa = 2.91
Molecular weight: 13.43 kDa
Isoelectric point according different methods:
Peptides (in silico digests for buttom-up proteomics)
Below you can find in silico digests of the whole proteome with Trypsin, Chymotrypsin, Trypsin+LysC, LysN, ArgC proteases suitable for different mass spec machines.| Try ESI |
 |
|---|
| ChTry ESI |
|
|---|
| ArgC ESI |
|
|---|
| LysN ESI |
|
|---|
| TryLysC ESI |
|
|---|
| Try MALDI |
|
|---|
| ChTry MALDI |
|
|---|
| ArgC MALDI |
|
|---|
| LysN MALDI |
|
|---|
| TryLysC MALDI |
|
|---|
| Try LTQ |
|
|---|
| ChTry LTQ |
|
|---|
| ArgC LTQ |
|
|---|
| LysN LTQ |
|
|---|
| TryLysC LTQ |
|
|---|
| Try MSlow |
|
|---|
| ChTry MSlow |
|
|---|
| ArgC MSlow |
|
|---|
| LysN MSlow |
|
|---|
| TryLysC MSlow |
|
|---|
| Try MShigh |
|
|---|
| ChTry MShigh |
|
|---|
| ArgC MShigh |
|
|---|
| LysN MShigh |
|
|---|
| TryLysC MShigh |
|
|---|
General Statistics
Number of major isoforms |
Number of additional isoforms |
Number of all proteins |
Number of amino acids |
Min. Seq. Length |
Max. Seq. Length |
Avg. Seq. Length |
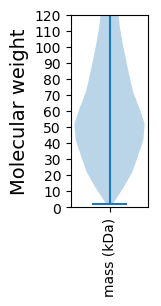
Avg. Mol. Weight |
|---|---|---|---|---|---|---|---|
36544125 |
17 |
8621 |
668.3 |
74.86 |
Amino acid frequency
Ala |
Cys |
Asp |
Glu |
Phe |
Gly |
His |
Ile |
Lys |
Leu |
|---|---|---|---|---|---|---|---|---|---|
6.423 ± 0.009 | 2.311 ± 0.009 |
5.258 ± 0.006 | 6.779 ± 0.011 |
3.838 ± 0.007 | 6.219 ± 0.012 |
2.667 ± 0.005 | 4.711 ± 0.007 |
5.719 ± 0.01 | 9.794 ± 0.013 |
Met |
Asn |
Gln |
Pro |
Arg |
Ser |
Thr |
Val |
Trp |
Tyr |
|---|---|---|---|---|---|---|---|---|---|
2.432 ± 0.004 | 3.958 ± 0.005 |
5.384 ± 0.011 | 4.7 ± 0.01 |
5.512 ± 0.007 | 8.243 ± 0.012 |
5.569 ± 0.008 | 6.406 ± 0.008 |
1.182 ± 0.003 | 2.892 ± 0.005 |
Most of the basic statistics you can see at this page can be downloaded from this CSV file
See this proteome in:

Proteome-pI is available under Creative Commons Attribution-NoDerivs license, for more details see here
| Reference: Kozlowski LP. Proteome-pI 2.0: Proteome Isoelectric Point Database Update. Nucleic Acids Res. 2021, doi: 10.1093/nar/gkab944 | Contact: Lukasz P. Kozlowski |