Xanthomonas phage Xoo-sp13
Taxonomy: Viruses; Duplodnaviria; Heunggongvirae; Uroviricota; Caudoviricetes; Caudovirales; Myoviridae; unclassified Myoviridae
Average proteome isoelectric point is 6.19
Get precalculated fractions of proteins
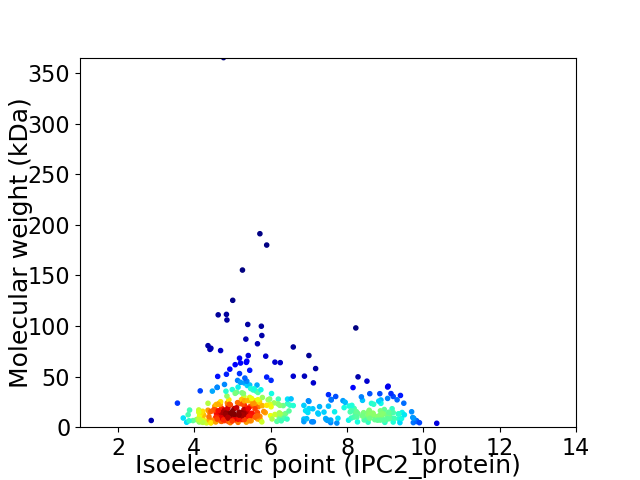
Virtual 2D-PAGE plot for 401 proteins (isoelectric point calculated using IPC2_protein)
Get csv file with sequences according to given criteria:
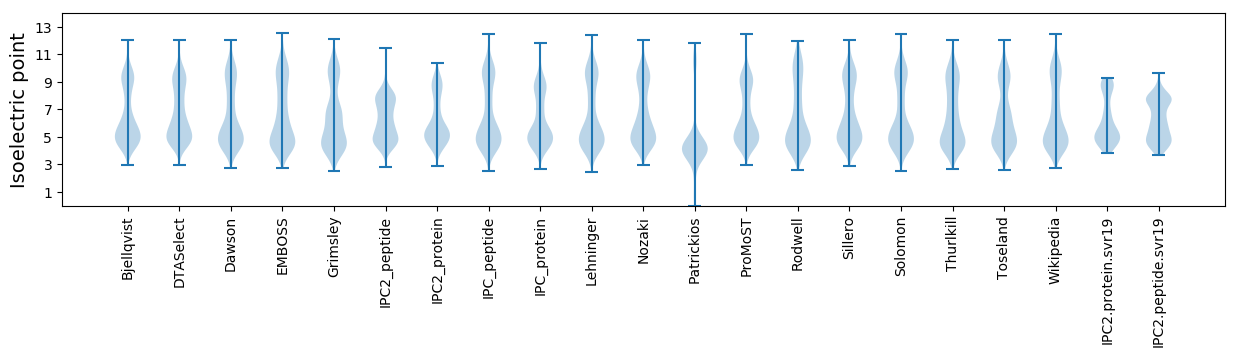
* You can choose from 21 different methods for calculating isoelectric point
Summary statistics related to proteome-wise predictions
Protein with the lowest isoelectric point:
>tr|A0A7D0GNP0|A0A7D0GNP0_9CAUD Uncharacterized protein OS=Xanthomonas phage Xoo-sp13 OX=2591401 GN=Xoosp13_12 PE=4 SV=1
MM1 pKa = 7.39LPWDD5 pKa = 3.87AQYY8 pKa = 9.79DD9 pKa = 4.36TVGLDD14 pKa = 3.32TNSARR19 pKa = 11.84LQIFIDD25 pKa = 3.85NVDD28 pKa = 3.31STKK31 pKa = 10.62PYY33 pKa = 10.84DD34 pKa = 3.78LVYY37 pKa = 9.43SCPVIGPEE45 pKa = 4.06YY46 pKa = 10.42KK47 pKa = 10.8AMPLVMQLAIEE58 pKa = 3.91LLIRR62 pKa = 11.84KK63 pKa = 6.21TCNGSDD69 pKa = 3.65PEE71 pKa = 4.13
MM1 pKa = 7.39LPWDD5 pKa = 3.87AQYY8 pKa = 9.79DD9 pKa = 4.36TVGLDD14 pKa = 3.32TNSARR19 pKa = 11.84LQIFIDD25 pKa = 3.85NVDD28 pKa = 3.31STKK31 pKa = 10.62PYY33 pKa = 10.84DD34 pKa = 3.78LVYY37 pKa = 9.43SCPVIGPEE45 pKa = 4.06YY46 pKa = 10.42KK47 pKa = 10.8AMPLVMQLAIEE58 pKa = 3.91LLIRR62 pKa = 11.84KK63 pKa = 6.21TCNGSDD69 pKa = 3.65PEE71 pKa = 4.13
Molecular weight: 7.98 kDa
Isoelectric point according different methods:
Protein with the highest isoelectric point:
>tr|A0A7D0KNL5|A0A7D0KNL5_9CAUD Dihydrofolate reductase OS=Xanthomonas phage Xoo-sp13 OX=2591401 GN=Xoosp13_185 PE=3 SV=1
MM1 pKa = 6.37STRR4 pKa = 11.84YY5 pKa = 9.28FVFSKK10 pKa = 10.77KK11 pKa = 10.36SFNRR15 pKa = 11.84TGTAKK20 pKa = 10.61ALKK23 pKa = 9.9NAATRR28 pKa = 11.84EE29 pKa = 3.96DD30 pKa = 3.37ARR32 pKa = 11.84DD33 pKa = 3.73FKK35 pKa = 11.19RR36 pKa = 11.84NQNSPTAYY44 pKa = 10.37GIMDD48 pKa = 4.51RR49 pKa = 11.84STGEE53 pKa = 3.93VIRR56 pKa = 4.88
MM1 pKa = 6.37STRR4 pKa = 11.84YY5 pKa = 9.28FVFSKK10 pKa = 10.77KK11 pKa = 10.36SFNRR15 pKa = 11.84TGTAKK20 pKa = 10.61ALKK23 pKa = 9.9NAATRR28 pKa = 11.84EE29 pKa = 3.96DD30 pKa = 3.37ARR32 pKa = 11.84DD33 pKa = 3.73FKK35 pKa = 11.19RR36 pKa = 11.84NQNSPTAYY44 pKa = 10.37GIMDD48 pKa = 4.51RR49 pKa = 11.84STGEE53 pKa = 3.93VIRR56 pKa = 4.88
Molecular weight: 6.39 kDa
Isoelectric point according different methods:
Peptides (in silico digests for buttom-up proteomics)
Below you can find in silico digests of the whole proteome with Trypsin, Chymotrypsin, Trypsin+LysC, LysN, ArgC proteases suitable for different mass spec machines.| Try ESI |
 |
|---|
| ChTry ESI |
|
|---|
| ArgC ESI |
|
|---|
| LysN ESI |
|
|---|
| TryLysC ESI |
|
|---|
| Try MALDI |
|
|---|
| ChTry MALDI |
|
|---|
| ArgC MALDI |
|
|---|
| LysN MALDI |
|
|---|
| TryLysC MALDI |
|
|---|
| Try LTQ |
|
|---|
| ChTry LTQ |
|
|---|
| ArgC LTQ |
|
|---|
| LysN LTQ |
|
|---|
| TryLysC LTQ |
|
|---|
| Try MSlow |
|
|---|
| ChTry MSlow |
|
|---|
| ArgC MSlow |
|
|---|
| LysN MSlow |
|
|---|
| TryLysC MSlow |
|
|---|
| Try MShigh |
|
|---|
| ChTry MShigh |
|
|---|
| ArgC MShigh |
|
|---|
| LysN MShigh |
|
|---|
| TryLysC MShigh |
|
|---|
General Statistics
Number of major isoforms |
Number of additional isoforms |
Number of all proteins |
Number of amino acids |
Min. Seq. Length |
Max. Seq. Length |
Avg. Seq. Length |
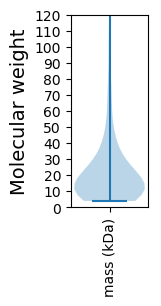
Avg. Mol. Weight |
|---|---|---|---|---|---|---|---|
0 |
84637 |
37 |
3245 |
211.1 |
23.65 |
Amino acid frequency
Ala |
Cys |
Asp |
Glu |
Phe |
Gly |
His |
Ile |
Lys |
Leu |
|---|---|---|---|---|---|---|---|---|---|
6.806 ± 0.157 | 0.916 ± 0.053 |
6.329 ± 0.151 | 5.845 ± 0.21 |
4.175 ± 0.098 | 6.204 ± 0.14 |
1.886 ± 0.078 | 6.36 ± 0.113 |
6.042 ± 0.243 | 7.634 ± 0.171 |
Met |
Asn |
Gln |
Pro |
Arg |
Ser |
Thr |
Val |
Trp |
Tyr |
|---|---|---|---|---|---|---|---|---|---|
2.434 ± 0.072 | 5.754 ± 0.159 |
4.474 ± 0.21 | 3.334 ± 0.097 |
4.473 ± 0.104 | 7.284 ± 0.168 |
7.532 ± 0.433 | 7.086 ± 0.13 |
1.373 ± 0.065 | 4.059 ± 0.112 |
Most of the basic statistics you can see at this page can be downloaded from this CSV file
See this proteome in:

Proteome-pI is available under Creative Commons Attribution-NoDerivs license, for more details see here
| Reference: Kozlowski LP. Proteome-pI 2.0: Proteome Isoelectric Point Database Update. Nucleic Acids Res. 2021, doi: 10.1093/nar/gkab944 | Contact: Lukasz P. Kozlowski |