Nocardioides sp. LS1
Taxonomy: cellular organisms; Bacteria; Terrabacteria group; Actinobacteria; Actinomycetia; Propionibacteriales; Nocardioidaceae; Nocardioides; unclassified Nocardioides
Average proteome isoelectric point is 5.98
Get precalculated fractions of proteins
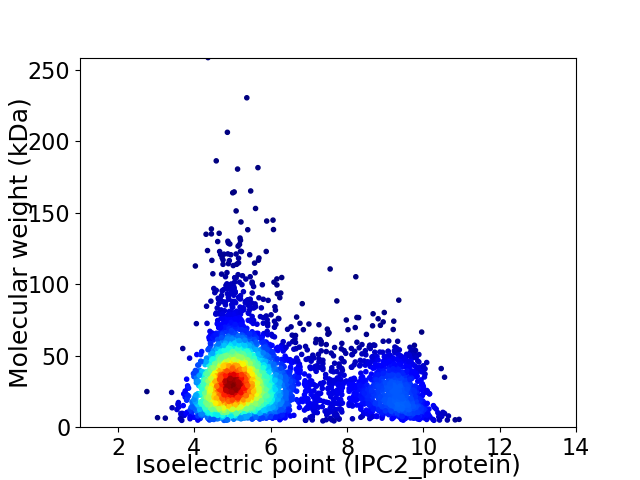
Virtual 2D-PAGE plot for 4366 proteins (isoelectric point calculated using IPC2_protein)
Get csv file with sequences according to given criteria:
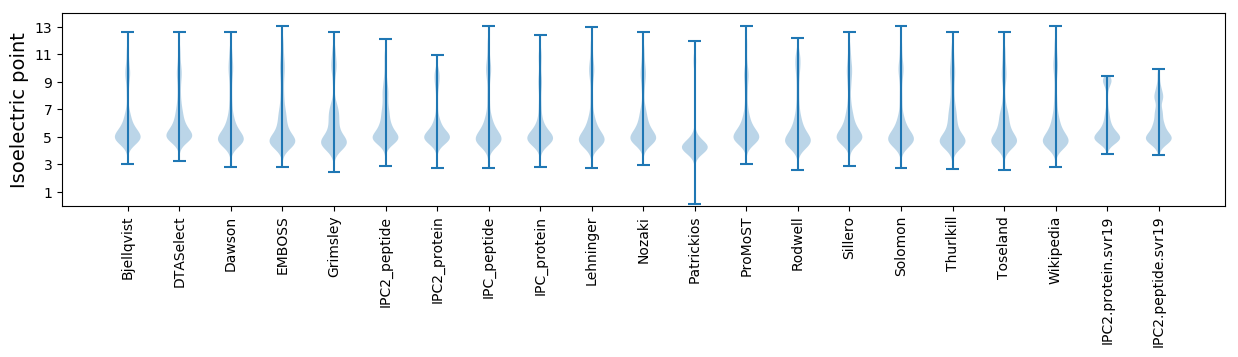
* You can choose from 21 different methods for calculating isoelectric point
Summary statistics related to proteome-wise predictions
Protein with the lowest isoelectric point:
>tr|A0A401Y118|A0A401Y118_9ACTN TetR family transcriptional regulator OS=Nocardioides sp. LS1 OX=1027620 GN=NLS1_03070 PE=4 SV=1
MM1 pKa = 7.15TLKK4 pKa = 9.87LTLDD8 pKa = 3.57LTSCTGCACCMMEE21 pKa = 5.54CPDD24 pKa = 5.34LFDD27 pKa = 5.83IDD29 pKa = 5.12DD30 pKa = 4.11EE31 pKa = 5.12SGLAVLLEE39 pKa = 4.14AHH41 pKa = 6.88PSDD44 pKa = 5.0DD45 pKa = 4.07RR46 pKa = 11.84LDD48 pKa = 3.67EE49 pKa = 4.23AEE51 pKa = 4.14RR52 pKa = 11.84AVRR55 pKa = 11.84SCPEE59 pKa = 3.57GAIVLEE65 pKa = 4.45QAA67 pKa = 4.09
MM1 pKa = 7.15TLKK4 pKa = 9.87LTLDD8 pKa = 3.57LTSCTGCACCMMEE21 pKa = 5.54CPDD24 pKa = 5.34LFDD27 pKa = 5.83IDD29 pKa = 5.12DD30 pKa = 4.11EE31 pKa = 5.12SGLAVLLEE39 pKa = 4.14AHH41 pKa = 6.88PSDD44 pKa = 5.0DD45 pKa = 4.07RR46 pKa = 11.84LDD48 pKa = 3.67EE49 pKa = 4.23AEE51 pKa = 4.14RR52 pKa = 11.84AVRR55 pKa = 11.84SCPEE59 pKa = 3.57GAIVLEE65 pKa = 4.45QAA67 pKa = 4.09
Molecular weight: 7.23 kDa
Isoelectric point according different methods:
Protein with the highest isoelectric point:
>tr|A0A401Y205|A0A401Y205_9ACTN Putative flavin-containing monoamine oxidase AofH OS=Nocardioides sp. LS1 OX=1027620 GN=aofH_2 PE=4 SV=1
MM1 pKa = 7.44KK2 pKa = 10.57LIIIALAAVAVLGGGRR18 pKa = 11.84FVSHH22 pKa = 7.33RR23 pKa = 11.84LATHH27 pKa = 5.14QRR29 pKa = 11.84VVPNPLARR37 pKa = 11.84INTQVHH43 pKa = 7.25RR44 pKa = 11.84INQQ47 pKa = 3.34
MM1 pKa = 7.44KK2 pKa = 10.57LIIIALAAVAVLGGGRR18 pKa = 11.84FVSHH22 pKa = 7.33RR23 pKa = 11.84LATHH27 pKa = 5.14QRR29 pKa = 11.84VVPNPLARR37 pKa = 11.84INTQVHH43 pKa = 7.25RR44 pKa = 11.84INQQ47 pKa = 3.34
Molecular weight: 5.15 kDa
Isoelectric point according different methods:
Peptides (in silico digests for buttom-up proteomics)
Below you can find in silico digests of the whole proteome with Trypsin, Chymotrypsin, Trypsin+LysC, LysN, ArgC proteases suitable for different mass spec machines.| Try ESI |
 |
|---|
| ChTry ESI |
|
|---|
| ArgC ESI |
|
|---|
| LysN ESI |
|
|---|
| TryLysC ESI |
|
|---|
| Try MALDI |
|
|---|
| ChTry MALDI |
|
|---|
| ArgC MALDI |
|
|---|
| LysN MALDI |
|
|---|
| TryLysC MALDI |
|
|---|
| Try LTQ |
|
|---|
| ChTry LTQ |
|
|---|
| ArgC LTQ |
|
|---|
| LysN LTQ |
|
|---|
| TryLysC LTQ |
|
|---|
| Try MSlow |
|
|---|
| ChTry MSlow |
|
|---|
| ArgC MSlow |
|
|---|
| LysN MSlow |
|
|---|
| TryLysC MSlow |
|
|---|
| Try MShigh |
|
|---|
| ChTry MShigh |
|
|---|
| ArgC MShigh |
|
|---|
| LysN MShigh |
|
|---|
| TryLysC MShigh |
|
|---|
General Statistics
Number of major isoforms |
Number of additional isoforms |
Number of all proteins |
Number of amino acids |
Min. Seq. Length |
Max. Seq. Length |
Avg. Seq. Length |
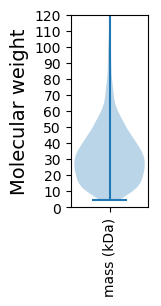
Avg. Mol. Weight |
|---|---|---|---|---|---|---|---|
0 |
1402571 |
40 |
2529 |
321.2 |
34.42 |
Amino acid frequency
Ala |
Cys |
Asp |
Glu |
Phe |
Gly |
His |
Ile |
Lys |
Leu |
|---|---|---|---|---|---|---|---|---|---|
12.831 ± 0.048 | 0.766 ± 0.01 |
6.536 ± 0.029 | 5.573 ± 0.038 |
2.858 ± 0.02 | 9.236 ± 0.032 |
2.407 ± 0.017 | 3.501 ± 0.025 |
2.121 ± 0.031 | 10.1 ± 0.048 |
Met |
Asn |
Gln |
Pro |
Arg |
Ser |
Thr |
Val |
Trp |
Tyr |
|---|---|---|---|---|---|---|---|---|---|
1.923 ± 0.016 | 1.89 ± 0.02 |
5.551 ± 0.028 | 2.764 ± 0.02 |
7.401 ± 0.04 | 5.365 ± 0.027 |
6.301 ± 0.037 | 9.348 ± 0.039 |
1.531 ± 0.017 | 1.994 ± 0.016 |
Most of the basic statistics you can see at this page can be downloaded from this CSV file
See this proteome in:

Proteome-pI is available under Creative Commons Attribution-NoDerivs license, for more details see here
| Reference: Kozlowski LP. Proteome-pI 2.0: Proteome Isoelectric Point Database Update. Nucleic Acids Res. 2021, doi: 10.1093/nar/gkab944 | Contact: Lukasz P. Kozlowski |