Bean yellow disorder virus
Taxonomy: Viruses; Riboviria; Orthornavirae; Kitrinoviricota; Alsuviricetes; Martellivirales; Closteroviridae; Crinivirus
Average proteome isoelectric point is 6.6
Get precalculated fractions of proteins
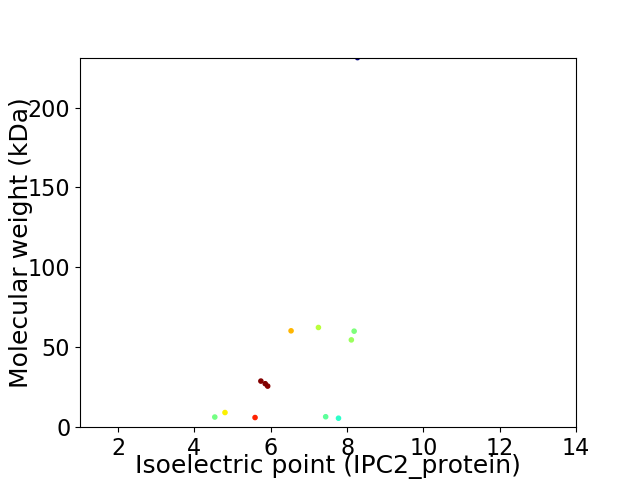
Virtual 2D-PAGE plot for 13 proteins (isoelectric point calculated using IPC2_protein)
Get csv file with sequences according to given criteria:
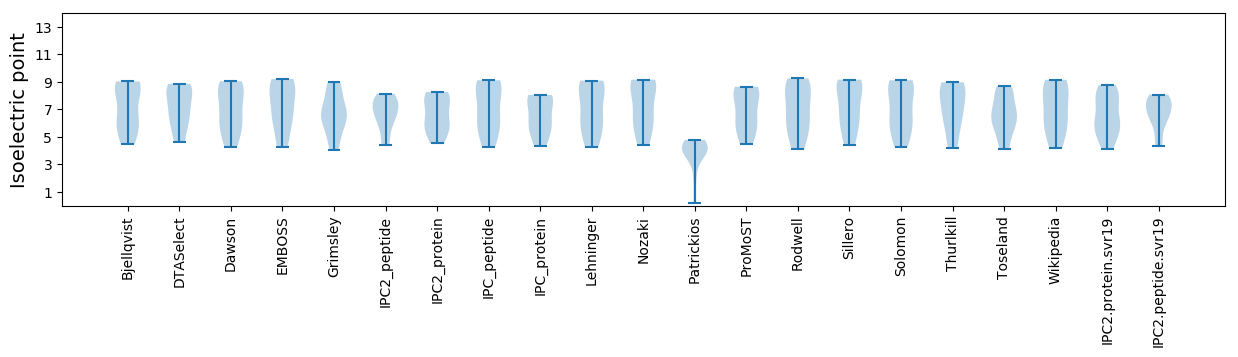
* You can choose from 21 different methods for calculating isoelectric point
Summary statistics related to proteome-wise predictions
Protein with the lowest isoelectric point:
>tr|B2BZW8|B2BZW8_9CLOS p60 OS=Bean yellow disorder virus OX=267970 PE=4 SV=1
MM1 pKa = 7.36GLKK4 pKa = 9.87IVIYY8 pKa = 8.2FHH10 pKa = 6.63NCGLIIYY17 pKa = 8.19YY18 pKa = 10.41CADD21 pKa = 3.17NRR23 pKa = 11.84DD24 pKa = 3.51FLGDD28 pKa = 3.54FEE30 pKa = 4.79VVRR33 pKa = 11.84TEE35 pKa = 4.53DD36 pKa = 3.66FSEE39 pKa = 4.55LSDD42 pKa = 4.23IITNFPFVKK51 pKa = 10.13TSWW54 pKa = 3.13
MM1 pKa = 7.36GLKK4 pKa = 9.87IVIYY8 pKa = 8.2FHH10 pKa = 6.63NCGLIIYY17 pKa = 8.19YY18 pKa = 10.41CADD21 pKa = 3.17NRR23 pKa = 11.84DD24 pKa = 3.51FLGDD28 pKa = 3.54FEE30 pKa = 4.79VVRR33 pKa = 11.84TEE35 pKa = 4.53DD36 pKa = 3.66FSEE39 pKa = 4.55LSDD42 pKa = 4.23IITNFPFVKK51 pKa = 10.13TSWW54 pKa = 3.13
Molecular weight: 6.36 kDa
Isoelectric point according different methods:
Protein with the highest isoelectric point:
>tr|B2BZW4|B2BZW4_9CLOS p6 OS=Bean yellow disorder virus OX=267970 PE=4 SV=1
MM1 pKa = 7.56GINYY5 pKa = 9.19GFLSHH10 pKa = 6.96ACNRR14 pKa = 11.84NGILYY19 pKa = 8.92NNSMCVVDD27 pKa = 6.48IIGFWLTVCVLIIILIYY44 pKa = 10.81LLFICFVKK52 pKa = 10.14FVIKK56 pKa = 10.52II57 pKa = 3.59
MM1 pKa = 7.56GINYY5 pKa = 9.19GFLSHH10 pKa = 6.96ACNRR14 pKa = 11.84NGILYY19 pKa = 8.92NNSMCVVDD27 pKa = 6.48IIGFWLTVCVLIIILIYY44 pKa = 10.81LLFICFVKK52 pKa = 10.14FVIKK56 pKa = 10.52II57 pKa = 3.59
Molecular weight: 6.55 kDa
Isoelectric point according different methods:
Peptides (in silico digests for buttom-up proteomics)
Below you can find in silico digests of the whole proteome with Trypsin, Chymotrypsin, Trypsin+LysC, LysN, ArgC proteases suitable for different mass spec machines.| Try ESI |
 |
|---|
| ChTry ESI |
|
|---|
| ArgC ESI |
|
|---|
| LysN ESI |
|
|---|
| TryLysC ESI |
|
|---|
| Try MALDI |
|
|---|
| ChTry MALDI |
|
|---|
| ArgC MALDI |
|
|---|
| LysN MALDI |
|
|---|
| TryLysC MALDI |
|
|---|
| Try LTQ |
|
|---|
| ChTry LTQ |
|
|---|
| ArgC LTQ |
|
|---|
| LysN LTQ |
|
|---|
| TryLysC LTQ |
|
|---|
| Try MSlow |
|
|---|
| ChTry MSlow |
|
|---|
| ArgC MSlow |
|
|---|
| LysN MSlow |
|
|---|
| TryLysC MSlow |
|
|---|
| Try MShigh |
|
|---|
| ChTry MShigh |
|
|---|
| ArgC MShigh |
|
|---|
| LysN MShigh |
|
|---|
| TryLysC MShigh |
|
|---|
General Statistics
Number of major isoforms |
Number of additional isoforms |
Number of all proteins |
Number of amino acids |
Min. Seq. Length |
Max. Seq. Length |
Avg. Seq. Length |
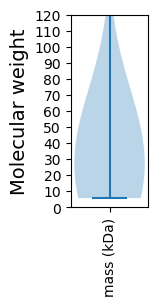
Avg. Mol. Weight |
|---|---|---|---|---|---|---|---|
0 |
5080 |
48 |
2021 |
390.8 |
44.94 |
Amino acid frequency
Ala |
Cys |
Asp |
Glu |
Phe |
Gly |
His |
Ile |
Lys |
Leu |
|---|---|---|---|---|---|---|---|---|---|
3.878 ± 0.252 | 2.087 ± 0.239 |
5.965 ± 0.282 | 5.591 ± 0.483 |
5.866 ± 0.608 | 5.039 ± 0.293 |
2.146 ± 0.295 | 6.811 ± 0.289 |
7.776 ± 0.453 | 9.528 ± 0.377 |
Met |
Asn |
Gln |
Pro |
Arg |
Ser |
Thr |
Val |
Trp |
Tyr |
|---|---|---|---|---|---|---|---|---|---|
2.697 ± 0.27 | 7.185 ± 0.378 |
3.406 ± 0.25 | 2.5 ± 0.214 |
4.862 ± 0.4 | 7.52 ± 0.399 |
5.02 ± 0.242 | 6.831 ± 0.626 |
0.807 ± 0.105 | 4.488 ± 0.221 |
Most of the basic statistics you can see at this page can be downloaded from this CSV file
See this proteome in:

Proteome-pI is available under Creative Commons Attribution-NoDerivs license, for more details see here
| Reference: Kozlowski LP. Proteome-pI 2.0: Proteome Isoelectric Point Database Update. Nucleic Acids Res. 2021, doi: 10.1093/nar/gkab944 | Contact: Lukasz P. Kozlowski |