Tomato infectious chlorosis virus
Taxonomy: Viruses; Riboviria; Orthornavirae; Kitrinoviricota; Alsuviricetes; Martellivirales; Closteroviridae; Crinivirus
Average proteome isoelectric point is 6.65
Get precalculated fractions of proteins
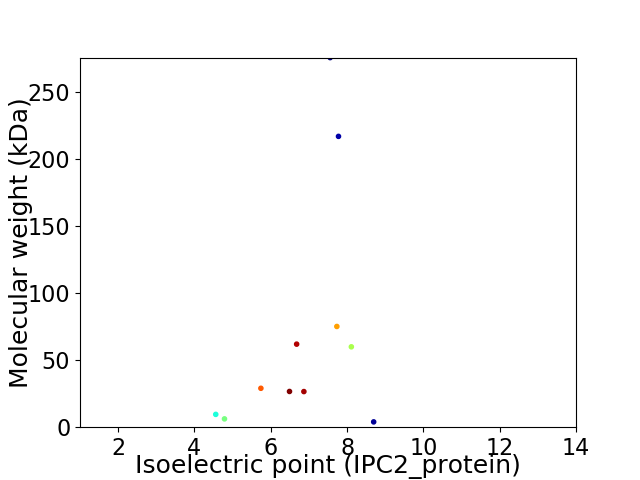
Virtual 2D-PAGE plot for 11 proteins (isoelectric point calculated using IPC2_protein)
Get csv file with sequences according to given criteria:
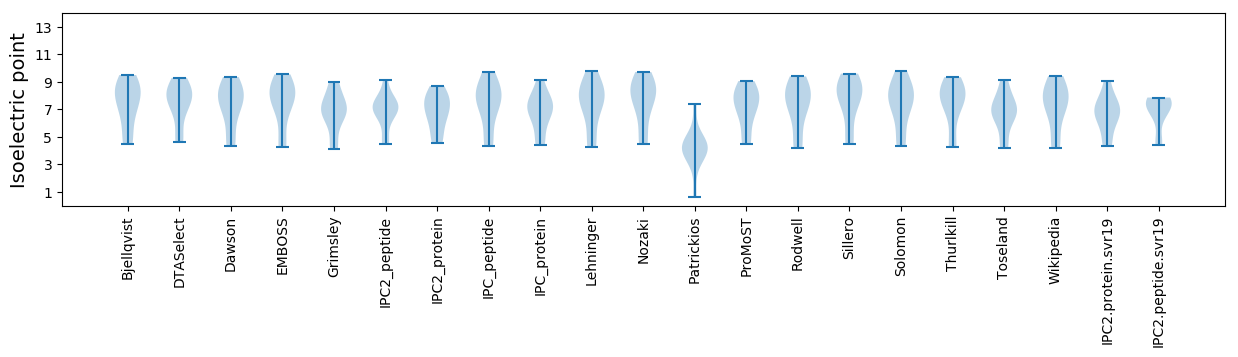
* You can choose from 21 different methods for calculating isoelectric point
Summary statistics related to proteome-wise predictions
Protein with the lowest isoelectric point:
>tr|C0K277|C0K277_9CLOS p4 OS=Tomato infectious chlorosis virus OX=52135 GN=ORF1 PE=4 SV=1
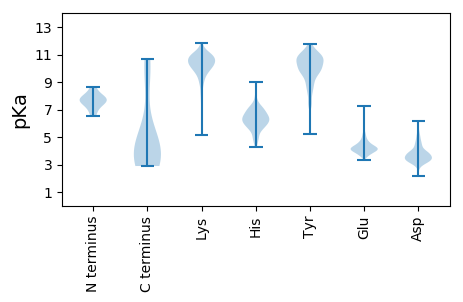
MM1 pKa = 7.89DD2 pKa = 4.37FEE4 pKa = 4.7ILIKK8 pKa = 10.43EE9 pKa = 3.98KK10 pKa = 10.71SPEE13 pKa = 3.78IFSVYY18 pKa = 9.94VNYY21 pKa = 10.29IINSYY26 pKa = 10.84YY27 pKa = 10.76NGLGPTSDD35 pKa = 5.34LLDD38 pKa = 4.97LINKK42 pKa = 8.83NFLTFSSRR50 pKa = 11.84EE51 pKa = 4.04CEE53 pKa = 3.46IDD55 pKa = 3.43SCIEE59 pKa = 4.1DD60 pKa = 4.11FDD62 pKa = 3.48IKK64 pKa = 11.25YY65 pKa = 10.45YY66 pKa = 10.15FRR68 pKa = 11.84CLEE71 pKa = 3.78YY72 pKa = 10.75CKK74 pKa = 10.37NGKK77 pKa = 9.49LIWW80 pKa = 4.15
MM1 pKa = 7.89DD2 pKa = 4.37FEE4 pKa = 4.7ILIKK8 pKa = 10.43EE9 pKa = 3.98KK10 pKa = 10.71SPEE13 pKa = 3.78IFSVYY18 pKa = 9.94VNYY21 pKa = 10.29IINSYY26 pKa = 10.84YY27 pKa = 10.76NGLGPTSDD35 pKa = 5.34LLDD38 pKa = 4.97LINKK42 pKa = 8.83NFLTFSSRR50 pKa = 11.84EE51 pKa = 4.04CEE53 pKa = 3.46IDD55 pKa = 3.43SCIEE59 pKa = 4.1DD60 pKa = 4.11FDD62 pKa = 3.48IKK64 pKa = 11.25YY65 pKa = 10.45YY66 pKa = 10.15FRR68 pKa = 11.84CLEE71 pKa = 3.78YY72 pKa = 10.75CKK74 pKa = 10.37NGKK77 pKa = 9.49LIWW80 pKa = 4.15
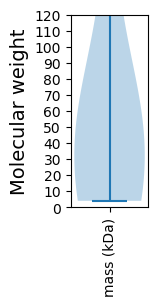
Molecular weight: 9.55 kDa
Isoelectric point according different methods:
Protein with the highest isoelectric point:
>tr|C0K284|C0K284_9CLOS p26 OS=Tomato infectious chlorosis virus OX=52135 GN=ORF8 PE=4 SV=1
MM1 pKa = 7.39AVVFYY6 pKa = 8.98LLCLFIIIILFTCRR20 pKa = 11.84ISIKK24 pKa = 10.28NIHH27 pKa = 5.71SVQHH31 pKa = 6.23RR32 pKa = 11.84FF33 pKa = 3.15
MM1 pKa = 7.39AVVFYY6 pKa = 8.98LLCLFIIIILFTCRR20 pKa = 11.84ISIKK24 pKa = 10.28NIHH27 pKa = 5.71SVQHH31 pKa = 6.23RR32 pKa = 11.84FF33 pKa = 3.15
Molecular weight: 3.95 kDa
Isoelectric point according different methods:
Peptides (in silico digests for buttom-up proteomics)
Below you can find in silico digests of the whole proteome with Trypsin, Chymotrypsin, Trypsin+LysC, LysN, ArgC proteases suitable for different mass spec machines.| Try ESI |
 |
|---|
| ChTry ESI |
|
|---|
| ArgC ESI |
|
|---|
| LysN ESI |
|
|---|
| TryLysC ESI |
|
|---|
| Try MALDI |
|
|---|
| ChTry MALDI |
|
|---|
| ArgC MALDI |
|
|---|
| LysN MALDI |
|
|---|
| TryLysC MALDI |
|
|---|
| Try LTQ |
|
|---|
| ChTry LTQ |
|
|---|
| ArgC LTQ |
|
|---|
| LysN LTQ |
|
|---|
| TryLysC LTQ |
|
|---|
| Try MSlow |
|
|---|
| ChTry MSlow |
|
|---|
| ArgC MSlow |
|
|---|
| LysN MSlow |
|
|---|
| TryLysC MSlow |
|
|---|
| Try MShigh |
|
|---|
| ChTry MShigh |
|
|---|
| ArgC MShigh |
|
|---|
| LysN MShigh |
|
|---|
| TryLysC MShigh |
|
|---|
General Statistics
Number of major isoforms |
Number of additional isoforms |
Number of all proteins |
Number of amino acids |
Min. Seq. Length |
Max. Seq. Length |
Avg. Seq. Length |
Avg. Mol. Weight |
|---|---|---|---|---|---|---|---|
0 |
6899 |
33 |
2394 |
627.2 |
71.86 |
Amino acid frequency
Ala |
Cys |
Asp |
Glu |
Phe |
Gly |
His |
Ile |
Lys |
Leu |
|---|---|---|---|---|---|---|---|---|---|
3.914 ± 0.362 | 1.87 ± 0.126 |
6.595 ± 0.186 | 5.523 ± 0.139 |
5.001 ± 0.154 | 4.914 ± 0.162 |
2.189 ± 0.225 | 6.247 ± 0.423 |
8.117 ± 0.231 | 9.552 ± 0.304 |
Met |
Asn |
Gln |
Pro |
Arg |
Ser |
Thr |
Val |
Trp |
Tyr |
|---|---|---|---|---|---|---|---|---|---|
3.073 ± 0.259 | 6.972 ± 0.316 |
3.015 ± 0.204 | 2.406 ± 0.206 |
4.667 ± 0.216 | 8.219 ± 0.581 |
5.189 ± 0.136 | 7.276 ± 0.285 |
0.754 ± 0.082 | 4.508 ± 0.245 |
Most of the basic statistics you can see at this page can be downloaded from this CSV file
See this proteome in:

Proteome-pI is available under Creative Commons Attribution-NoDerivs license, for more details see here
| Reference: Kozlowski LP. Proteome-pI 2.0: Proteome Isoelectric Point Database Update. Nucleic Acids Res. 2021, doi: 10.1093/nar/gkab944 | Contact: Lukasz P. Kozlowski |