Salmonella phage LPST10
Taxonomy: Viruses; Duplodnaviria; Heunggongvirae; Uroviricota; Caudoviricetes; Caudovirales; Siphoviridae; unclassified Siphoviridae
Average proteome isoelectric point is 6.51
Get precalculated fractions of proteins
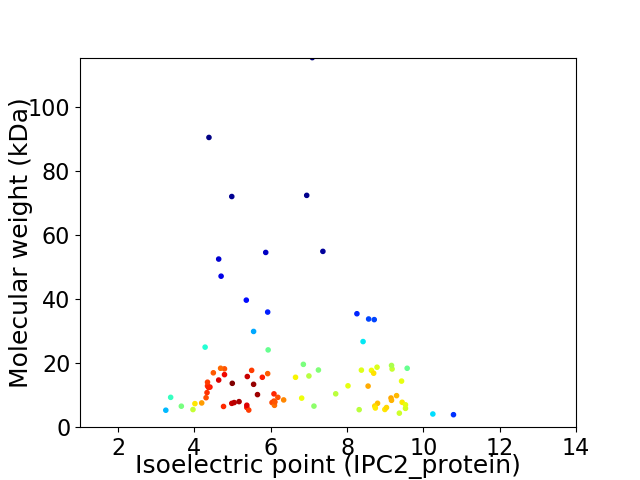
Virtual 2D-PAGE plot for 87 proteins (isoelectric point calculated using IPC2_protein)
Get csv file with sequences according to given criteria:
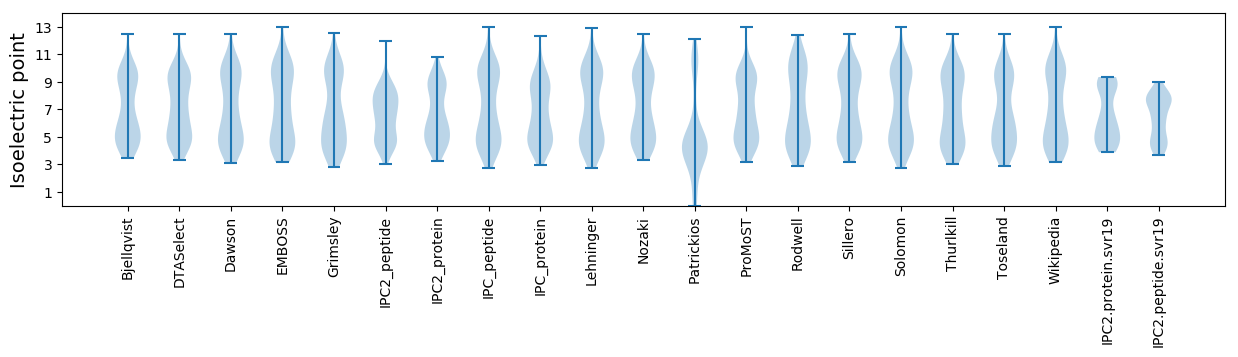
* You can choose from 21 different methods for calculating isoelectric point
Summary statistics related to proteome-wise predictions
Protein with the lowest isoelectric point:
>tr|A0A1W6DXU8|A0A1W6DXU8_9CAUD Uncharacterized protein OS=Salmonella phage LPST10 OX=1973454 GN=LPST10_00031 PE=4 SV=1
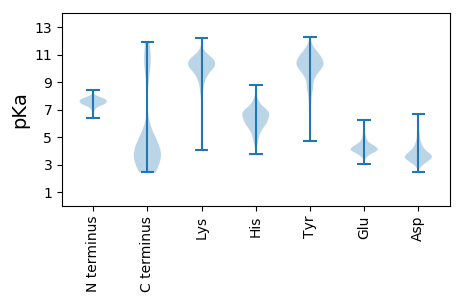
MM1 pKa = 6.99SQWIKK6 pKa = 10.51CSEE9 pKa = 3.86RR10 pKa = 11.84MPEE13 pKa = 3.91HH14 pKa = 6.49FSDD17 pKa = 3.99VLVTDD22 pKa = 4.63GVGVEE27 pKa = 4.32VKK29 pKa = 9.86WLDD32 pKa = 4.33EE33 pKa = 4.25NYY35 pKa = 10.08CWDD38 pKa = 3.99SFTEE42 pKa = 4.01NNSNIRR48 pKa = 11.84SCDD51 pKa = 3.23VVYY54 pKa = 10.39WMPLPEE60 pKa = 4.99PPQEE64 pKa = 3.96
MM1 pKa = 6.99SQWIKK6 pKa = 10.51CSEE9 pKa = 3.86RR10 pKa = 11.84MPEE13 pKa = 3.91HH14 pKa = 6.49FSDD17 pKa = 3.99VLVTDD22 pKa = 4.63GVGVEE27 pKa = 4.32VKK29 pKa = 9.86WLDD32 pKa = 4.33EE33 pKa = 4.25NYY35 pKa = 10.08CWDD38 pKa = 3.99SFTEE42 pKa = 4.01NNSNIRR48 pKa = 11.84SCDD51 pKa = 3.23VVYY54 pKa = 10.39WMPLPEE60 pKa = 4.99PPQEE64 pKa = 3.96
Molecular weight: 7.57 kDa
Isoelectric point according different methods:
Protein with the highest isoelectric point:
>tr|A0A1W6DXU9|A0A1W6DXU9_9CAUD Exonuclease OS=Salmonella phage LPST10 OX=1973454 GN=LPST10_00006 PE=4 SV=1
MM1 pKa = 7.76GSTNSPSRR9 pKa = 11.84SRR11 pKa = 11.84ATGNTKK17 pKa = 9.72TGGKK21 pKa = 7.78TGAVKK26 pKa = 10.54PNGSTRR32 pKa = 11.84SPSRR36 pKa = 11.84GKK38 pKa = 10.36KK39 pKa = 9.35
MM1 pKa = 7.76GSTNSPSRR9 pKa = 11.84SRR11 pKa = 11.84ATGNTKK17 pKa = 9.72TGGKK21 pKa = 7.78TGAVKK26 pKa = 10.54PNGSTRR32 pKa = 11.84SPSRR36 pKa = 11.84GKK38 pKa = 10.36KK39 pKa = 9.35
Molecular weight: 3.91 kDa
Isoelectric point according different methods:
Peptides (in silico digests for buttom-up proteomics)
Below you can find in silico digests of the whole proteome with Trypsin, Chymotrypsin, Trypsin+LysC, LysN, ArgC proteases suitable for different mass spec machines.| Try ESI |
 |
|---|
| ChTry ESI |
|
|---|
| ArgC ESI |
|
|---|
| LysN ESI |
|
|---|
| TryLysC ESI |
|
|---|
| Try MALDI |
|
|---|
| ChTry MALDI |
|
|---|
| ArgC MALDI |
|
|---|
| LysN MALDI |
|
|---|
| TryLysC MALDI |
|
|---|
| Try LTQ |
|
|---|
| ChTry LTQ |
|
|---|
| ArgC LTQ |
|
|---|
| LysN LTQ |
|
|---|
| TryLysC LTQ |
|
|---|
| Try MSlow |
|
|---|
| ChTry MSlow |
|
|---|
| ArgC MSlow |
|
|---|
| LysN MSlow |
|
|---|
| TryLysC MSlow |
|
|---|
| Try MShigh |
|
|---|
| ChTry MShigh |
|
|---|
| ArgC MShigh |
|
|---|
| LysN MShigh |
|
|---|
| TryLysC MShigh |
|
|---|
General Statistics
Number of major isoforms |
Number of additional isoforms |
Number of all proteins |
Number of amino acids |
Min. Seq. Length |
Max. Seq. Length |
Avg. Seq. Length |
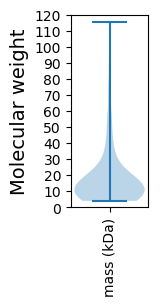
Avg. Mol. Weight |
|---|---|---|---|---|---|---|---|
0 |
14423 |
37 |
1097 |
165.8 |
18.52 |
Amino acid frequency
Ala |
Cys |
Asp |
Glu |
Phe |
Gly |
His |
Ile |
Lys |
Leu |
|---|---|---|---|---|---|---|---|---|---|
8.944 ± 0.756 | 1.595 ± 0.225 |
6.219 ± 0.319 | 6.559 ± 0.318 |
3.487 ± 0.2 | 7.259 ± 0.272 |
1.879 ± 0.214 | 6.906 ± 0.216 |
6.524 ± 0.371 | 6.913 ± 0.208 |
Met |
Asn |
Gln |
Pro |
Arg |
Ser |
Thr |
Val |
Trp |
Tyr |
|---|---|---|---|---|---|---|---|---|---|
3.12 ± 0.195 | 4.631 ± 0.206 |
3.134 ± 0.236 | 3.917 ± 0.364 |
5.304 ± 0.232 | 6.559 ± 0.271 |
5.429 ± 0.383 | 6.406 ± 0.249 |
1.484 ± 0.155 | 3.73 ± 0.229 |
Most of the basic statistics you can see at this page can be downloaded from this CSV file
See this proteome in:

Proteome-pI is available under Creative Commons Attribution-NoDerivs license, for more details see here
| Reference: Kozlowski LP. Proteome-pI 2.0: Proteome Isoelectric Point Database Update. Nucleic Acids Res. 2021, doi: 10.1093/nar/gkab944 | Contact: Lukasz P. Kozlowski |