Microbacterium phage Efeko
Taxonomy: Viruses; Duplodnaviria; Heunggongvirae; Uroviricota; Caudoviricetes; Caudovirales; Siphoviridae; unclassified Siphoviridae
Average proteome isoelectric point is 6.29
Get precalculated fractions of proteins
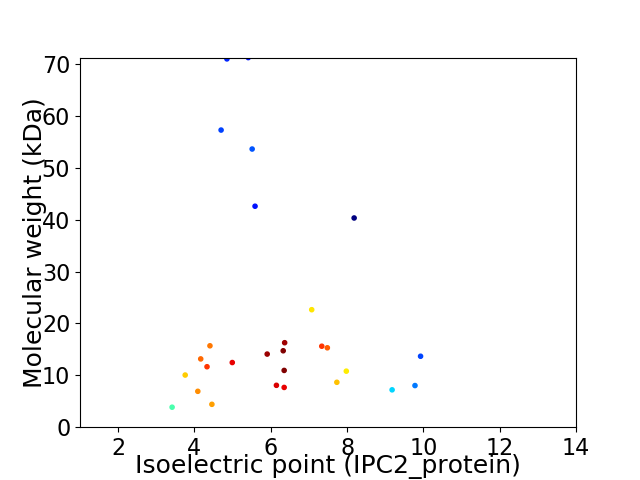
Virtual 2D-PAGE plot for 28 proteins (isoelectric point calculated using IPC2_protein)
Get csv file with sequences according to given criteria:
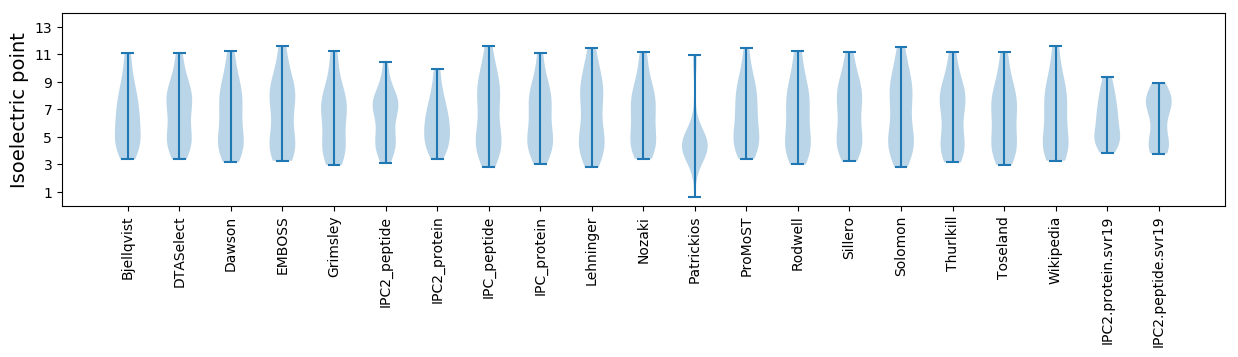
* You can choose from 21 different methods for calculating isoelectric point
Summary statistics related to proteome-wise predictions
Protein with the lowest isoelectric point:
>tr|A0A386KP29|A0A386KP29_9CAUD HNH endonuclease OS=Microbacterium phage Efeko OX=2315704 GN=27 PE=4 SV=1
MM1 pKa = 6.75TTFLRR6 pKa = 11.84IDD8 pKa = 3.85PEE10 pKa = 4.16TGQLIEE16 pKa = 4.62CGSRR20 pKa = 11.84TVVCEE25 pKa = 3.62TAGCEE30 pKa = 3.79NVGISIEE37 pKa = 4.39VADD40 pKa = 5.0DD41 pKa = 3.69PNGAVVCGPCGRR53 pKa = 11.84WIIAPPTEE61 pKa = 4.23QEE63 pKa = 4.17TPAA66 pKa = 5.02
MM1 pKa = 6.75TTFLRR6 pKa = 11.84IDD8 pKa = 3.85PEE10 pKa = 4.16TGQLIEE16 pKa = 4.62CGSRR20 pKa = 11.84TVVCEE25 pKa = 3.62TAGCEE30 pKa = 3.79NVGISIEE37 pKa = 4.39VADD40 pKa = 5.0DD41 pKa = 3.69PNGAVVCGPCGRR53 pKa = 11.84WIIAPPTEE61 pKa = 4.23QEE63 pKa = 4.17TPAA66 pKa = 5.02
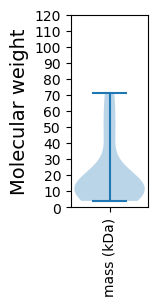
Molecular weight: 6.92 kDa
Isoelectric point according different methods:
Protein with the highest isoelectric point:
>tr|A0A386KLN1|A0A386KLN1_9CAUD Minor tail protein OS=Microbacterium phage Efeko OX=2315704 GN=14 PE=4 SV=1
MM1 pKa = 7.92TDD3 pKa = 3.88PKK5 pKa = 10.7PLTRR9 pKa = 11.84RR10 pKa = 11.84EE11 pKa = 3.58RR12 pKa = 11.84RR13 pKa = 11.84LQLRR17 pKa = 11.84AKK19 pKa = 8.04TEE21 pKa = 4.48RR22 pKa = 11.84IATPALRR29 pKa = 11.84RR30 pKa = 11.84WAYY33 pKa = 9.83GVAAAAVAAGVGFGWLPAGSAALLLPLLGALFYY66 pKa = 11.14VDD68 pKa = 5.2DD69 pKa = 5.06AGEE72 pKa = 3.96PRR74 pKa = 11.84AA75 pKa = 4.23
MM1 pKa = 7.92TDD3 pKa = 3.88PKK5 pKa = 10.7PLTRR9 pKa = 11.84RR10 pKa = 11.84EE11 pKa = 3.58RR12 pKa = 11.84RR13 pKa = 11.84LQLRR17 pKa = 11.84AKK19 pKa = 8.04TEE21 pKa = 4.48RR22 pKa = 11.84IATPALRR29 pKa = 11.84RR30 pKa = 11.84WAYY33 pKa = 9.83GVAAAAVAAGVGFGWLPAGSAALLLPLLGALFYY66 pKa = 11.14VDD68 pKa = 5.2DD69 pKa = 5.06AGEE72 pKa = 3.96PRR74 pKa = 11.84AA75 pKa = 4.23
Molecular weight: 8.03 kDa
Isoelectric point according different methods:
Peptides (in silico digests for buttom-up proteomics)
Below you can find in silico digests of the whole proteome with Trypsin, Chymotrypsin, Trypsin+LysC, LysN, ArgC proteases suitable for different mass spec machines.| Try ESI |
 |
|---|
| ChTry ESI |
|
|---|
| ArgC ESI |
|
|---|
| LysN ESI |
|
|---|
| TryLysC ESI |
|
|---|
| Try MALDI |
|
|---|
| ChTry MALDI |
|
|---|
| ArgC MALDI |
|
|---|
| LysN MALDI |
|
|---|
| TryLysC MALDI |
|
|---|
| Try LTQ |
|
|---|
| ChTry LTQ |
|
|---|
| ArgC LTQ |
|
|---|
| LysN LTQ |
|
|---|
| TryLysC LTQ |
|
|---|
| Try MSlow |
|
|---|
| ChTry MSlow |
|
|---|
| ArgC MSlow |
|
|---|
| LysN MSlow |
|
|---|
| TryLysC MSlow |
|
|---|
| Try MShigh |
|
|---|
| ChTry MShigh |
|
|---|
| ArgC MShigh |
|
|---|
| LysN MShigh |
|
|---|
| TryLysC MShigh |
|
|---|
General Statistics
Number of major isoforms |
Number of additional isoforms |
Number of all proteins |
Number of amino acids |
Min. Seq. Length |
Max. Seq. Length |
Avg. Seq. Length |
Avg. Mol. Weight |
|---|---|---|---|---|---|---|---|
0 |
5499 |
36 |
699 |
196.4 |
21.01 |
Amino acid frequency
Ala |
Cys |
Asp |
Glu |
Phe |
Gly |
His |
Ile |
Lys |
Leu |
|---|---|---|---|---|---|---|---|---|---|
13.184 ± 0.48 | 0.491 ± 0.194 |
5.619 ± 0.396 | 5.383 ± 0.478 |
2.855 ± 0.243 | 9.238 ± 0.426 |
1.4 ± 0.211 | 4.455 ± 0.358 |
2.164 ± 0.243 | 9.493 ± 0.813 |
Met |
Asn |
Gln |
Pro |
Arg |
Ser |
Thr |
Val |
Trp |
Tyr |
|---|---|---|---|---|---|---|---|---|---|
2.146 ± 0.262 | 2.873 ± 0.24 |
5.055 ± 0.372 | 3.964 ± 0.328 |
7.092 ± 0.704 | 6.219 ± 0.55 |
6.947 ± 0.362 | 7.674 ± 0.485 |
1.418 ± 0.226 | 2.328 ± 0.281 |
Most of the basic statistics you can see at this page can be downloaded from this CSV file
See this proteome in:

Proteome-pI is available under Creative Commons Attribution-NoDerivs license, for more details see here
| Reference: Kozlowski LP. Proteome-pI 2.0: Proteome Isoelectric Point Database Update. Nucleic Acids Res. 2021, doi: 10.1093/nar/gkab944 | Contact: Lukasz P. Kozlowski |