Streptococcus satellite phage Javan571
Taxonomy: Viruses; unclassified bacterial viruses
Average proteome isoelectric point is 6.89
Get precalculated fractions of proteins
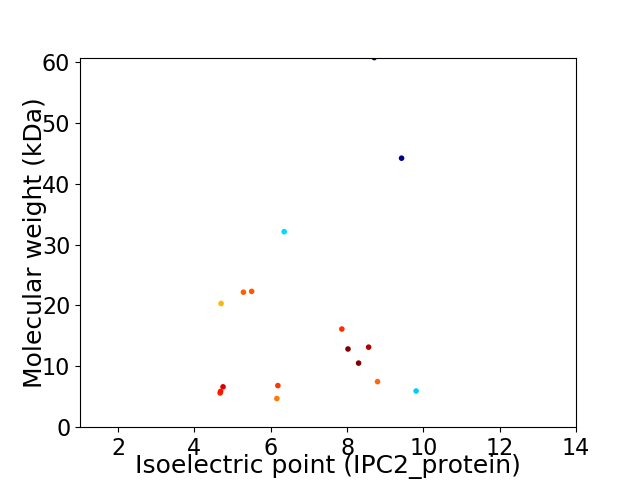
Virtual 2D-PAGE plot for 17 proteins (isoelectric point calculated using IPC2_protein)
Get csv file with sequences according to given criteria:
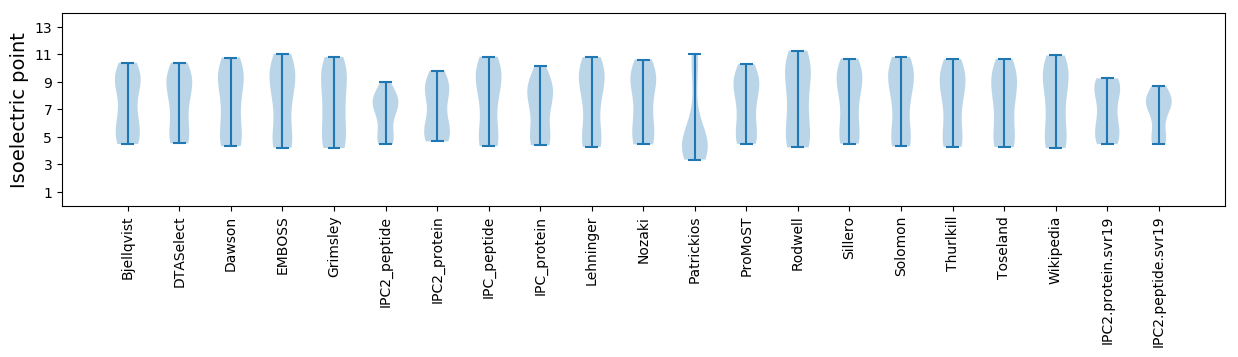
* You can choose from 21 different methods for calculating isoelectric point
Summary statistics related to proteome-wise predictions
Protein with the lowest isoelectric point:
>tr|A0A4D5ZRJ3|A0A4D5ZRJ3_9VIRU Uncharacterized protein OS=Streptococcus satellite phage Javan571 OX=2558753 GN=JavanS571_0002 PE=4 SV=1
MM1 pKa = 7.41NSFVALDD8 pKa = 3.65VEE10 pKa = 4.78TANSFRR16 pKa = 11.84GSLCAIGLVKK26 pKa = 10.5FEE28 pKa = 4.67NGKK31 pKa = 8.54ITDD34 pKa = 4.33FFYY37 pKa = 11.22SHH39 pKa = 7.32INPEE43 pKa = 3.84EE44 pKa = 3.81EE45 pKa = 3.71FQYY48 pKa = 11.09FF49 pKa = 3.31
MM1 pKa = 7.41NSFVALDD8 pKa = 3.65VEE10 pKa = 4.78TANSFRR16 pKa = 11.84GSLCAIGLVKK26 pKa = 10.5FEE28 pKa = 4.67NGKK31 pKa = 8.54ITDD34 pKa = 4.33FFYY37 pKa = 11.22SHH39 pKa = 7.32INPEE43 pKa = 3.84EE44 pKa = 3.81EE45 pKa = 3.71FQYY48 pKa = 11.09FF49 pKa = 3.31
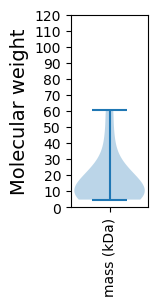
Molecular weight: 5.63 kDa
Isoelectric point according different methods:
Protein with the highest isoelectric point:
>tr|A0A4D5ZVP4|A0A4D5ZVP4_9VIRU Uncharacterized protein OS=Streptococcus satellite phage Javan571 OX=2558753 GN=JavanS571_0004 PE=4 SV=1
MM1 pKa = 7.61TNFQTYY7 pKa = 10.09LGYY10 pKa = 10.01GQPYY14 pKa = 10.03RR15 pKa = 11.84MADD18 pKa = 3.07EE19 pKa = 5.76HH20 pKa = 5.9IWKK23 pKa = 9.84DD24 pKa = 3.46RR25 pKa = 11.84RR26 pKa = 11.84PTLEE30 pKa = 4.79HH31 pKa = 6.51IKK33 pKa = 9.99EE34 pKa = 3.96QQRR37 pKa = 11.84LKK39 pKa = 10.73KK40 pKa = 10.24LKK42 pKa = 10.01KK43 pKa = 9.67KK44 pKa = 9.88RR45 pKa = 11.84RR46 pKa = 11.84KK47 pKa = 9.34
MM1 pKa = 7.61TNFQTYY7 pKa = 10.09LGYY10 pKa = 10.01GQPYY14 pKa = 10.03RR15 pKa = 11.84MADD18 pKa = 3.07EE19 pKa = 5.76HH20 pKa = 5.9IWKK23 pKa = 9.84DD24 pKa = 3.46RR25 pKa = 11.84RR26 pKa = 11.84PTLEE30 pKa = 4.79HH31 pKa = 6.51IKK33 pKa = 9.99EE34 pKa = 3.96QQRR37 pKa = 11.84LKK39 pKa = 10.73KK40 pKa = 10.24LKK42 pKa = 10.01KK43 pKa = 9.67KK44 pKa = 9.88RR45 pKa = 11.84RR46 pKa = 11.84KK47 pKa = 9.34
Molecular weight: 5.95 kDa
Isoelectric point according different methods:
Peptides (in silico digests for buttom-up proteomics)
Below you can find in silico digests of the whole proteome with Trypsin, Chymotrypsin, Trypsin+LysC, LysN, ArgC proteases suitable for different mass spec machines.| Try ESI |
 |
|---|
| ChTry ESI |
|
|---|
| ArgC ESI |
|
|---|
| LysN ESI |
|
|---|
| TryLysC ESI |
|
|---|
| Try MALDI |
|
|---|
| ChTry MALDI |
|
|---|
| ArgC MALDI |
|
|---|
| LysN MALDI |
|
|---|
| TryLysC MALDI |
|
|---|
| Try LTQ |
|
|---|
| ChTry LTQ |
|
|---|
| ArgC LTQ |
|
|---|
| LysN LTQ |
|
|---|
| TryLysC LTQ |
|
|---|
| Try MSlow |
|
|---|
| ChTry MSlow |
|
|---|
| ArgC MSlow |
|
|---|
| LysN MSlow |
|
|---|
| TryLysC MSlow |
|
|---|
| Try MShigh |
|
|---|
| ChTry MShigh |
|
|---|
| ArgC MShigh |
|
|---|
| LysN MShigh |
|
|---|
| TryLysC MShigh |
|
|---|
General Statistics
Number of major isoforms |
Number of additional isoforms |
Number of all proteins |
Number of amino acids |
Min. Seq. Length |
Max. Seq. Length |
Avg. Seq. Length |
Avg. Mol. Weight |
|---|---|---|---|---|---|---|---|
0 |
2568 |
39 |
533 |
151.1 |
17.51 |
Amino acid frequency
Ala |
Cys |
Asp |
Glu |
Phe |
Gly |
His |
Ile |
Lys |
Leu |
|---|---|---|---|---|---|---|---|---|---|
6.269 ± 0.462 | 0.467 ± 0.148 |
5.763 ± 0.386 | 8.178 ± 0.93 |
4.011 ± 0.458 | 4.79 ± 0.571 |
1.908 ± 0.251 | 6.114 ± 0.603 |
9.54 ± 0.604 | 10.436 ± 0.773 |
Met |
Asn |
Gln |
Pro |
Arg |
Ser |
Thr |
Val |
Trp |
Tyr |
|---|---|---|---|---|---|---|---|---|---|
2.22 ± 0.327 | 4.868 ± 0.651 |
3.388 ± 0.585 | 4.984 ± 0.382 |
5.763 ± 0.458 | 4.829 ± 0.5 |
5.919 ± 0.521 | 5.101 ± 0.504 |
0.779 ± 0.118 | 4.673 ± 0.363 |
Most of the basic statistics you can see at this page can be downloaded from this CSV file
See this proteome in:

Proteome-pI is available under Creative Commons Attribution-NoDerivs license, for more details see here
| Reference: Kozlowski LP. Proteome-pI 2.0: Proteome Isoelectric Point Database Update. Nucleic Acids Res. 2021, doi: 10.1093/nar/gkab944 | Contact: Lukasz P. Kozlowski |