Bacteroides sp. CAG:709
Taxonomy: cellular organisms; Bacteria; FCB group; Bacteroidetes/Chlorobi group; Bacteroidetes; Bacteroidia; Bacteroidales; Bacteroidaceae; Bacteroides; environmental samples
Average proteome isoelectric point is 6.14
Get precalculated fractions of proteins
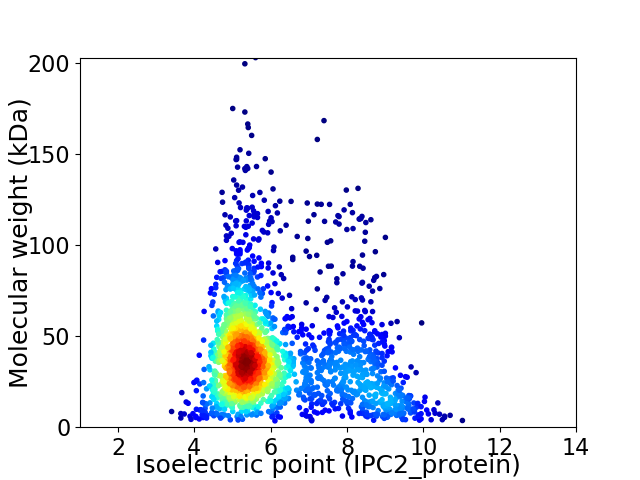
Virtual 2D-PAGE plot for 2178 proteins (isoelectric point calculated using IPC2_protein)
Get csv file with sequences according to given criteria:
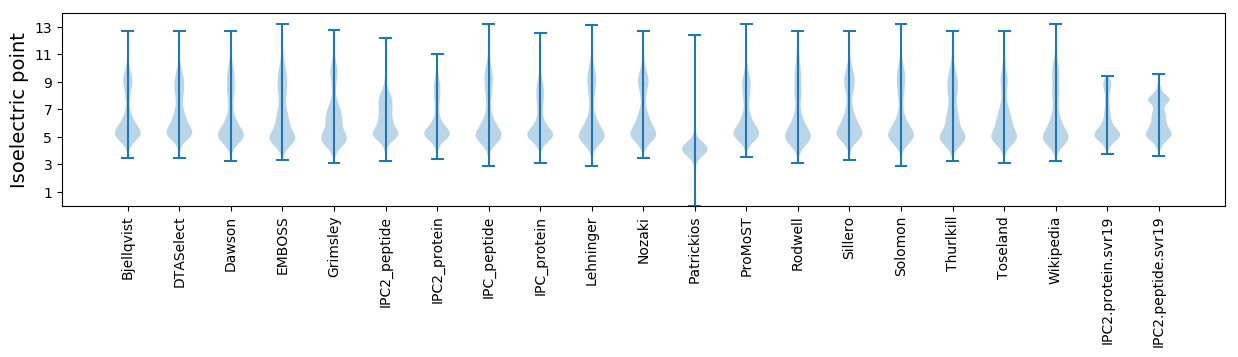
* You can choose from 21 different methods for calculating isoelectric point
Summary statistics related to proteome-wise predictions
Protein with the lowest isoelectric point:
>tr|R6E7E9|R6E7E9_9BACE Uncharacterized protein OS=Bacteroides sp. CAG:709 OX=1262748 GN=BN760_00663 PE=4 SV=1
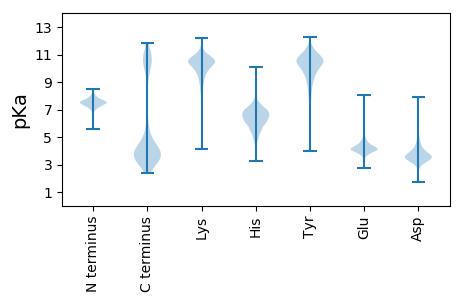
MM1 pKa = 7.57NIYY4 pKa = 8.75KK5 pKa = 9.64TDD7 pKa = 3.66LVKK10 pKa = 10.5AACYY14 pKa = 7.34EE15 pKa = 4.22APSVTVFNVVAEE27 pKa = 4.21NGFCDD32 pKa = 4.6SGSKK36 pKa = 10.09PSNANSDD43 pKa = 3.91DD44 pKa = 4.0PDD46 pKa = 3.93DD47 pKa = 4.56FEE49 pKa = 5.97FGGMFYY55 pKa = 11.1
MM1 pKa = 7.57NIYY4 pKa = 8.75KK5 pKa = 9.64TDD7 pKa = 3.66LVKK10 pKa = 10.5AACYY14 pKa = 7.34EE15 pKa = 4.22APSVTVFNVVAEE27 pKa = 4.21NGFCDD32 pKa = 4.6SGSKK36 pKa = 10.09PSNANSDD43 pKa = 3.91DD44 pKa = 4.0PDD46 pKa = 3.93DD47 pKa = 4.56FEE49 pKa = 5.97FGGMFYY55 pKa = 11.1
Molecular weight: 5.98 kDa
Isoelectric point according different methods:
Protein with the highest isoelectric point:
>tr|R6ETR1|R6ETR1_9BACE Uncharacterized protein OS=Bacteroides sp. CAG:709 OX=1262748 GN=BN760_01649 PE=4 SV=1
MM1 pKa = 7.84PSGKK5 pKa = 9.39KK6 pKa = 9.62RR7 pKa = 11.84KK8 pKa = 6.72RR9 pKa = 11.84HH10 pKa = 5.17KK11 pKa = 10.05MATHH15 pKa = 6.02KK16 pKa = 10.34RR17 pKa = 11.84KK18 pKa = 9.84KK19 pKa = 9.28RR20 pKa = 11.84LRR22 pKa = 11.84KK23 pKa = 9.26NRR25 pKa = 11.84HH26 pKa = 4.71KK27 pKa = 10.87KK28 pKa = 9.36KK29 pKa = 10.77
MM1 pKa = 7.84PSGKK5 pKa = 9.39KK6 pKa = 9.62RR7 pKa = 11.84KK8 pKa = 6.72RR9 pKa = 11.84HH10 pKa = 5.17KK11 pKa = 10.05MATHH15 pKa = 6.02KK16 pKa = 10.34RR17 pKa = 11.84KK18 pKa = 9.84KK19 pKa = 9.28RR20 pKa = 11.84LRR22 pKa = 11.84KK23 pKa = 9.26NRR25 pKa = 11.84HH26 pKa = 4.71KK27 pKa = 10.87KK28 pKa = 9.36KK29 pKa = 10.77
Molecular weight: 3.68 kDa
Isoelectric point according different methods:
Peptides (in silico digests for buttom-up proteomics)
Below you can find in silico digests of the whole proteome with Trypsin, Chymotrypsin, Trypsin+LysC, LysN, ArgC proteases suitable for different mass spec machines.| Try ESI |
 |
|---|
| ChTry ESI |
|
|---|
| ArgC ESI |
|
|---|
| LysN ESI |
|
|---|
| TryLysC ESI |
|
|---|
| Try MALDI |
|
|---|
| ChTry MALDI |
|
|---|
| ArgC MALDI |
|
|---|
| LysN MALDI |
|
|---|
| TryLysC MALDI |
|
|---|
| Try LTQ |
|
|---|
| ChTry LTQ |
|
|---|
| ArgC LTQ |
|
|---|
| LysN LTQ |
|
|---|
| TryLysC LTQ |
|
|---|
| Try MSlow |
|
|---|
| ChTry MSlow |
|
|---|
| ArgC MSlow |
|
|---|
| LysN MSlow |
|
|---|
| TryLysC MSlow |
|
|---|
| Try MShigh |
|
|---|
| ChTry MShigh |
|
|---|
| ArgC MShigh |
|
|---|
| LysN MShigh |
|
|---|
| TryLysC MShigh |
|
|---|
General Statistics
Number of major isoforms |
Number of additional isoforms |
Number of all proteins |
Number of amino acids |
Min. Seq. Length |
Max. Seq. Length |
Avg. Seq. Length |
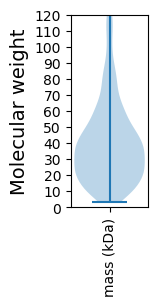
Avg. Mol. Weight |
|---|---|---|---|---|---|---|---|
0 |
817153 |
29 |
1858 |
375.2 |
41.79 |
Amino acid frequency
Ala |
Cys |
Asp |
Glu |
Phe |
Gly |
His |
Ile |
Lys |
Leu |
|---|---|---|---|---|---|---|---|---|---|
8.111 ± 0.054 | 1.343 ± 0.022 |
6.118 ± 0.029 | 6.245 ± 0.052 |
4.437 ± 0.029 | 7.544 ± 0.045 |
1.685 ± 0.023 | 6.415 ± 0.044 |
6.337 ± 0.036 | 8.248 ± 0.042 |
Met |
Asn |
Gln |
Pro |
Arg |
Ser |
Thr |
Val |
Trp |
Tyr |
|---|---|---|---|---|---|---|---|---|---|
2.834 ± 0.023 | 4.678 ± 0.044 |
3.813 ± 0.025 | 2.696 ± 0.024 |
4.68 ± 0.042 | 6.859 ± 0.048 |
5.569 ± 0.045 | 6.879 ± 0.037 |
1.307 ± 0.021 | 4.195 ± 0.038 |
Most of the basic statistics you can see at this page can be downloaded from this CSV file
See this proteome in:

Proteome-pI is available under Creative Commons Attribution-NoDerivs license, for more details see here
| Reference: Kozlowski LP. Proteome-pI 2.0: Proteome Isoelectric Point Database Update. Nucleic Acids Res. 2021, doi: 10.1093/nar/gkab944 | Contact: Lukasz P. Kozlowski |