Novosphingobium sp. P6W
Taxonomy: cellular organisms; Bacteria; Proteobacteria; Alphaproteobacteria; Sphingomonadales; Sphingomonadaceae; Novosphingobium; unclassified Novosphingobium
Average proteome isoelectric point is 6.48
Get precalculated fractions of proteins
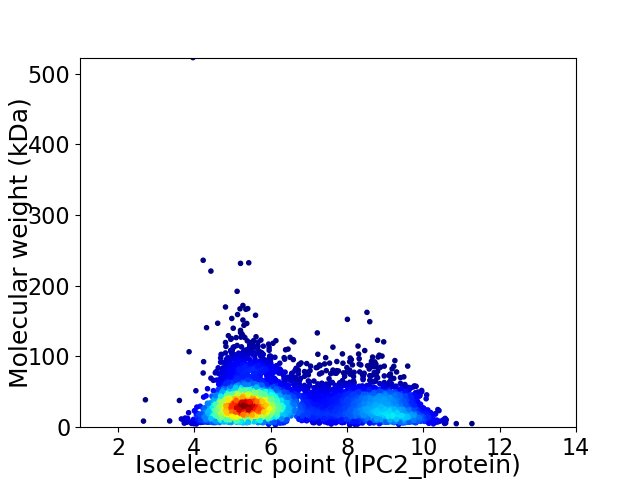
Virtual 2D-PAGE plot for 5625 proteins (isoelectric point calculated using IPC2_protein)
Get csv file with sequences according to given criteria:
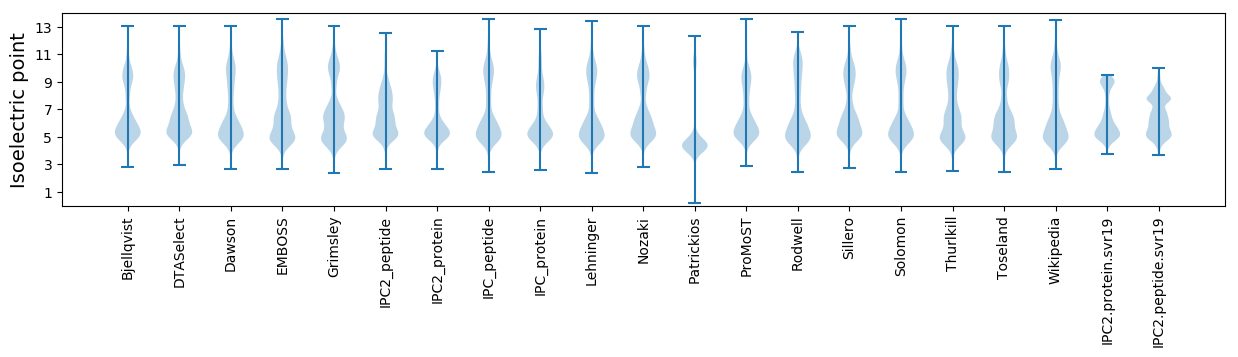
* You can choose from 21 different methods for calculating isoelectric point
Summary statistics related to proteome-wise predictions
Protein with the lowest isoelectric point:
>tr|A0A2Z5EDH3|A0A2Z5EDH3_9SPHN Redox-sensitive transcriptional activator SoxR OS=Novosphingobium sp. P6W OX=1609758 GN=soxR PE=4 SV=1
MM1 pKa = 7.76RR2 pKa = 11.84STYY5 pKa = 10.47EE6 pKa = 3.88SATVRR11 pKa = 11.84LYY13 pKa = 10.97HH14 pKa = 6.95LDD16 pKa = 3.45GGAEE20 pKa = 3.89GGAANTLFYY29 pKa = 11.15GPLSEE34 pKa = 5.17AMTIAAQQSEE44 pKa = 4.53DD45 pKa = 3.65VQDD48 pKa = 3.94GLFIATDD55 pKa = 3.73NDD57 pKa = 3.24VVAYY61 pKa = 10.33VDD63 pKa = 5.94LIEE66 pKa = 3.99QQ67 pKa = 3.64
MM1 pKa = 7.76RR2 pKa = 11.84STYY5 pKa = 10.47EE6 pKa = 3.88SATVRR11 pKa = 11.84LYY13 pKa = 10.97HH14 pKa = 6.95LDD16 pKa = 3.45GGAEE20 pKa = 3.89GGAANTLFYY29 pKa = 11.15GPLSEE34 pKa = 5.17AMTIAAQQSEE44 pKa = 4.53DD45 pKa = 3.65VQDD48 pKa = 3.94GLFIATDD55 pKa = 3.73NDD57 pKa = 3.24VVAYY61 pKa = 10.33VDD63 pKa = 5.94LIEE66 pKa = 3.99QQ67 pKa = 3.64
Molecular weight: 7.2 kDa
Isoelectric point according different methods:
Protein with the highest isoelectric point:
>tr|A0A2Z5E8A5|A0A2Z5E8A5_9SPHN Uncharacterized protein OS=Novosphingobium sp. P6W OX=1609758 GN=TQ38_004280 PE=4 SV=1
MM1 pKa = 7.45KK2 pKa = 9.61RR3 pKa = 11.84TFQPSNLVRR12 pKa = 11.84ARR14 pKa = 11.84RR15 pKa = 11.84HH16 pKa = 4.37GFRR19 pKa = 11.84LRR21 pKa = 11.84MSTVGGRR28 pKa = 11.84KK29 pKa = 9.08VIRR32 pKa = 11.84ARR34 pKa = 11.84RR35 pKa = 11.84ARR37 pKa = 11.84GRR39 pKa = 11.84AKK41 pKa = 10.7LSAA44 pKa = 4.0
MM1 pKa = 7.45KK2 pKa = 9.61RR3 pKa = 11.84TFQPSNLVRR12 pKa = 11.84ARR14 pKa = 11.84RR15 pKa = 11.84HH16 pKa = 4.37GFRR19 pKa = 11.84LRR21 pKa = 11.84MSTVGGRR28 pKa = 11.84KK29 pKa = 9.08VIRR32 pKa = 11.84ARR34 pKa = 11.84RR35 pKa = 11.84ARR37 pKa = 11.84GRR39 pKa = 11.84AKK41 pKa = 10.7LSAA44 pKa = 4.0
Molecular weight: 5.11 kDa
Isoelectric point according different methods:
Peptides (in silico digests for buttom-up proteomics)
Below you can find in silico digests of the whole proteome with Trypsin, Chymotrypsin, Trypsin+LysC, LysN, ArgC proteases suitable for different mass spec machines.| Try ESI |
 |
|---|
| ChTry ESI |
|
|---|
| ArgC ESI |
|
|---|
| LysN ESI |
|
|---|
| TryLysC ESI |
|
|---|
| Try MALDI |
|
|---|
| ChTry MALDI |
|
|---|
| ArgC MALDI |
|
|---|
| LysN MALDI |
|
|---|
| TryLysC MALDI |
|
|---|
| Try LTQ |
|
|---|
| ChTry LTQ |
|
|---|
| ArgC LTQ |
|
|---|
| LysN LTQ |
|
|---|
| TryLysC LTQ |
|
|---|
| Try MSlow |
|
|---|
| ChTry MSlow |
|
|---|
| ArgC MSlow |
|
|---|
| LysN MSlow |
|
|---|
| TryLysC MSlow |
|
|---|
| Try MShigh |
|
|---|
| ChTry MShigh |
|
|---|
| ArgC MShigh |
|
|---|
| LysN MShigh |
|
|---|
| TryLysC MShigh |
|
|---|
General Statistics
Number of major isoforms |
Number of additional isoforms |
Number of all proteins |
Number of amino acids |
Min. Seq. Length |
Max. Seq. Length |
Avg. Seq. Length |
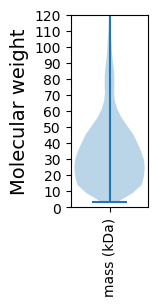
Avg. Mol. Weight |
|---|---|---|---|---|---|---|---|
0 |
1878612 |
31 |
5080 |
334.0 |
36.07 |
Amino acid frequency
Ala |
Cys |
Asp |
Glu |
Phe |
Gly |
His |
Ile |
Lys |
Leu |
|---|---|---|---|---|---|---|---|---|---|
13.065 ± 0.048 | 0.831 ± 0.01 |
5.838 ± 0.027 | 5.352 ± 0.033 |
3.606 ± 0.021 | 9.018 ± 0.034 |
2.024 ± 0.016 | 4.85 ± 0.023 |
2.958 ± 0.021 | 9.802 ± 0.037 |
Met |
Asn |
Gln |
Pro |
Arg |
Ser |
Thr |
Val |
Trp |
Tyr |
|---|---|---|---|---|---|---|---|---|---|
2.434 ± 0.016 | 2.62 ± 0.022 |
5.248 ± 0.022 | 3.175 ± 0.019 |
7.183 ± 0.033 | 5.584 ± 0.028 |
5.374 ± 0.025 | 7.247 ± 0.024 |
1.462 ± 0.014 | 2.325 ± 0.02 |
Most of the basic statistics you can see at this page can be downloaded from this CSV file
See this proteome in:

Proteome-pI is available under Creative Commons Attribution-NoDerivs license, for more details see here
| Reference: Kozlowski LP. Proteome-pI 2.0: Proteome Isoelectric Point Database Update. Nucleic Acids Res. 2021, doi: 10.1093/nar/gkab944 | Contact: Lukasz P. Kozlowski |