Sphingopyxis sp. (strain 113P3)
Taxonomy: cellular organisms; Bacteria; Proteobacteria; Alphaproteobacteria; Sphingomonadales; Sphingomonadaceae; Sphingopyxis; unclassified Sphingopyxis
Average proteome isoelectric point is 6.58
Get precalculated fractions of proteins
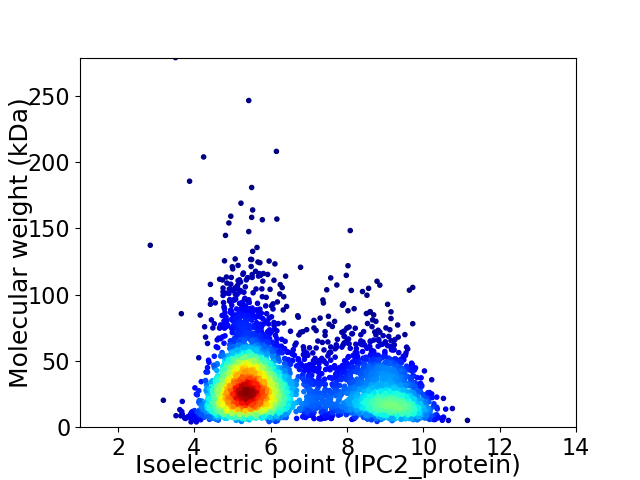
Virtual 2D-PAGE plot for 4365 proteins (isoelectric point calculated using IPC2_protein)
Get csv file with sequences according to given criteria:
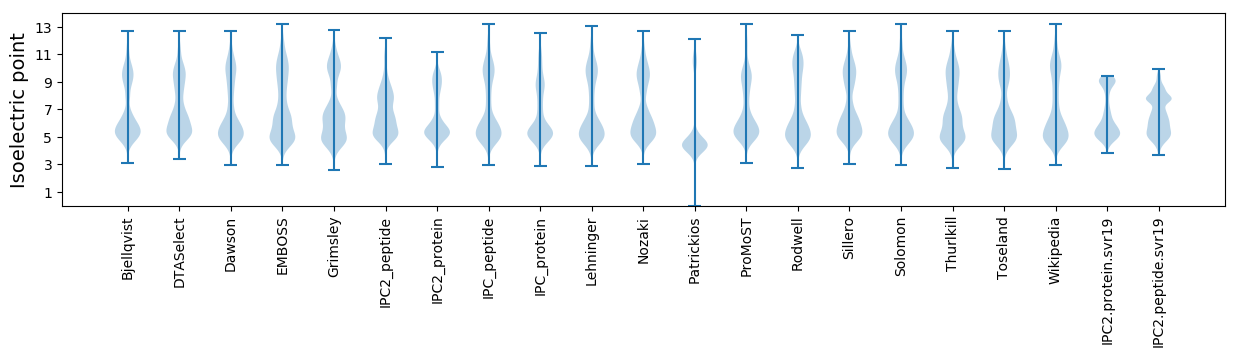
* You can choose from 21 different methods for calculating isoelectric point
Summary statistics related to proteome-wise predictions
Protein with the lowest isoelectric point:
>tr|A0A0M3QEF2|A0A0M3QEF2_SPHS1 ABC transporter permease OS=Sphingopyxis sp. (strain 113P3) OX=292913 GN=LH20_19970 PE=4 SV=1
MM1 pKa = 7.9WYY3 pKa = 10.07FSWVLGVGLAVGFGILNGMWHH24 pKa = 6.68EE25 pKa = 4.14FHH27 pKa = 7.62SDD29 pKa = 3.49PDD31 pKa = 3.8DD32 pKa = 4.26DD33 pKa = 4.58AAAA36 pKa = 4.34
MM1 pKa = 7.9WYY3 pKa = 10.07FSWVLGVGLAVGFGILNGMWHH24 pKa = 6.68EE25 pKa = 4.14FHH27 pKa = 7.62SDD29 pKa = 3.49PDD31 pKa = 3.8DD32 pKa = 4.26DD33 pKa = 4.58AAAA36 pKa = 4.34
Molecular weight: 4.01 kDa
Isoelectric point according different methods:
Protein with the highest isoelectric point:
>tr|A0A0M4CV26|A0A0M4CV26_SPHS1 Uncharacterized protein OS=Sphingopyxis sp. (strain 113P3) OX=292913 GN=LH20_12170 PE=4 SV=1
MM1 pKa = 7.35KK2 pKa = 9.4RR3 pKa = 11.84TYY5 pKa = 10.2QPSRR9 pKa = 11.84LVRR12 pKa = 11.84KK13 pKa = 9.21RR14 pKa = 11.84RR15 pKa = 11.84HH16 pKa = 4.57GFRR19 pKa = 11.84ARR21 pKa = 11.84KK22 pKa = 7.81ATVGGRR28 pKa = 11.84KK29 pKa = 9.05VLAARR34 pKa = 11.84RR35 pKa = 11.84ARR37 pKa = 11.84GRR39 pKa = 11.84KK40 pKa = 9.02KK41 pKa = 10.61LSAA44 pKa = 4.03
MM1 pKa = 7.35KK2 pKa = 9.4RR3 pKa = 11.84TYY5 pKa = 10.2QPSRR9 pKa = 11.84LVRR12 pKa = 11.84KK13 pKa = 9.21RR14 pKa = 11.84RR15 pKa = 11.84HH16 pKa = 4.57GFRR19 pKa = 11.84ARR21 pKa = 11.84KK22 pKa = 7.81ATVGGRR28 pKa = 11.84KK29 pKa = 9.05VLAARR34 pKa = 11.84RR35 pKa = 11.84ARR37 pKa = 11.84GRR39 pKa = 11.84KK40 pKa = 9.02KK41 pKa = 10.61LSAA44 pKa = 4.03
Molecular weight: 5.13 kDa
Isoelectric point according different methods:
Peptides (in silico digests for buttom-up proteomics)
Below you can find in silico digests of the whole proteome with Trypsin, Chymotrypsin, Trypsin+LysC, LysN, ArgC proteases suitable for different mass spec machines.| Try ESI |
 |
|---|
| ChTry ESI |
|
|---|
| ArgC ESI |
|
|---|
| LysN ESI |
|
|---|
| TryLysC ESI |
|
|---|
| Try MALDI |
|
|---|
| ChTry MALDI |
|
|---|
| ArgC MALDI |
|
|---|
| LysN MALDI |
|
|---|
| TryLysC MALDI |
|
|---|
| Try LTQ |
|
|---|
| ChTry LTQ |
|
|---|
| ArgC LTQ |
|
|---|
| LysN LTQ |
|
|---|
| TryLysC LTQ |
|
|---|
| Try MSlow |
|
|---|
| ChTry MSlow |
|
|---|
| ArgC MSlow |
|
|---|
| LysN MSlow |
|
|---|
| TryLysC MSlow |
|
|---|
| Try MShigh |
|
|---|
| ChTry MShigh |
|
|---|
| ArgC MShigh |
|
|---|
| LysN MShigh |
|
|---|
| TryLysC MShigh |
|
|---|
General Statistics
Number of major isoforms |
Number of additional isoforms |
Number of all proteins |
Number of amino acids |
Min. Seq. Length |
Max. Seq. Length |
Avg. Seq. Length |
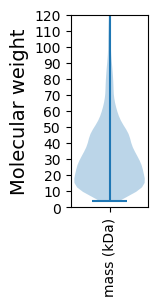
Avg. Mol. Weight |
|---|---|---|---|---|---|---|---|
0 |
1371085 |
36 |
2935 |
314.1 |
33.98 |
Amino acid frequency
Ala |
Cys |
Asp |
Glu |
Phe |
Gly |
His |
Ile |
Lys |
Leu |
|---|---|---|---|---|---|---|---|---|---|
13.675 ± 0.055 | 0.804 ± 0.011 |
5.986 ± 0.031 | 5.627 ± 0.033 |
3.526 ± 0.022 | 8.797 ± 0.039 |
2.019 ± 0.023 | 5.075 ± 0.024 |
3.028 ± 0.027 | 9.812 ± 0.046 |
Met |
Asn |
Gln |
Pro |
Arg |
Ser |
Thr |
Val |
Trp |
Tyr |
|---|---|---|---|---|---|---|---|---|---|
2.38 ± 0.019 | 2.448 ± 0.024 |
5.361 ± 0.03 | 2.955 ± 0.02 |
7.63 ± 0.034 | 5.265 ± 0.027 |
5.055 ± 0.031 | 6.829 ± 0.03 |
1.491 ± 0.015 | 2.238 ± 0.017 |
Most of the basic statistics you can see at this page can be downloaded from this CSV file
See this proteome in:

Proteome-pI is available under Creative Commons Attribution-NoDerivs license, for more details see here
| Reference: Kozlowski LP. Proteome-pI 2.0: Proteome Isoelectric Point Database Update. Nucleic Acids Res. 2021, doi: 10.1093/nar/gkab944 | Contact: Lukasz P. Kozlowski |